

“Over the years we’ve invested significantly in our field data team - focusing on producing trusted ratings. While this ensures the accuracy of our Ratings, it doesn’t allow the scale across the thousands of projects that buyers are considering.”

For more information on carbon credit procurement trends, read our "Key Takeaways for 2025" article. We share five, data-backed tips to improve your procurement strategy.
One more thing: Connect to Supply customers also get access to the rest of Sylvera's tools. That means you can easily see project ratings and evaluate an individual project's strengths, procure quality carbon credits, and even monitor project activity (particularly if you’ve invested at the pre-issuance stage.)
Book a free demo of Sylvera to see our platform's procurement and reporting features in action.
Circular procurement becomes practical when procurement can compare suppliers using the same definitions, the same evidence standards, and the same reporting cadence. This article shows how to build a tender assessment matrix that makes circular performance comparable and manageable across sites and contractors.
The Procurement Challenge: Cost, Compliance, and Sustainability Outcomes
Waste contracts increasingly sit at the intersection of cost, compliance, and sustainability. To balance these requirements, procurement teams can use a tender assessment matrix that scores not only price and service, but also treatment transparency and the ability to provide consistent, evidence-backed reporting across sites. This article provides a practical guide to building that matrix and using it to qualify waste processors on circular outcomes.
Define your criteria and non-negotiables first
The first step is to decide what the contract needs to deliver and what you will treat as non-negotiable. Common options include the ability to provide reporting by site and waste stream on a defined cadence, transparency on treatment outcomes, and the ability to provide supporting documentation when requested. Many organisations also set operational requirements such as minimum service levels, clear escalation routes, and coverage across the required sites, plus compliance requirements for regulated streams where relevant. Once these requirements are defined, the assessment matrix becomes a practical way to compare suppliers on price, service performance, and circular outcomes using criteria you can carry into contract governance after award.
Build the assessment matrix
A good assessment matrix does two things at the same time. It creates a fair, comparable basis for awarding the contract, and it sets the rules you will use to manage the supplier after award. The simplest approach is to start with a small set of pass/fail gates (non-negotiables), then score the remaining bids across four blocks: A. Price, B. Transport, C. Treatment outcomes, and D. Added value.
Pass/fail gates (non-negotiables)
These gates remove suppliers you can’t manage in practice, regardless of price.
- Reporting capability: ability to provide reporting by site × waste stream on a defined cadence (monthly or quarterly).
- Evidence availability: ability to provide supporting documentation on request (for example invoices, weighbridge/weight ticket references, transfer documentation where applicable).
- Compliance readiness: ability to demonstrate the required permits/authorisations for the services in scope, and to disclose subcontracting/handovers where relevant.
Four scoring blocks
Once the gates are met, score suppliers across the same blocks you will use for ongoing governance:
- A. Price: unit rates per stream (including hazardous/non-hazardous where relevant), container costs, and the charges/assumptions that materially affect total cost.
- B. Transport: kilometres travelled per waste stream, with vehicle type as a secondary differentiator.
- C. Treatment outcomes: outcome split per waste stream (% reused where relevant, % recycled, % recovered, % disposed) under your definitions.
- D. Added value: qualitative rating (e.g., stars) for end-to-end service, communication/escalation, practical sustainability support, and tendering/onboarding support.

Choose weights that fit your procurement reality
Waste tenders are often price-led. You can keep price weight high and still qualify suppliers on circular outcomes by giving outcomes and data a defined place in the scorecard.
Two examples of workable weighting models:
- Light-touch (common starting point): Price 65–75% | Transport 10–15% | Circular outcomes 10% | Data & evidence 5–10%
- Outcome-driven (when circularity is strategic): Price 50–60% | Transport 10–15% | Circular outcomes 15–25% | Data & evidence 10–15%

Block A: Commercials (Price and cost model)
Price comparison works best when every bidder completes the same table with unit rates per waste stream. Use the units that match your operations (for example €/emptying, €/container/month, €/tonne or €/kg) and keep the structure consistent across sites.
Ask for:
- Unit rates per waste stream, split into non-hazardous and hazardous streams where relevant.
- Container costs, including rental or purchase of additional containers, swaps, and any fixed monthly service fees linked to container types.
- Charges and assumptions that change total cost, such as ad-hoc collections, and the re-pricing triggers (volume changes, added sites, changes in streams in scope).
Scoring approach: calculate a comparable total cost using the same assumed volumes and frequencies for all bidders, then score from lowest to highest. Use the clarity of variable charges and re-pricing triggers as a secondary scoring factor where bids are otherwise close.
Block B: Transport
Transport scoring can stay straightforward. Ask bidders to provide the kilometres travelled per waste stream for your sites, based on the processing location they intend to use. Most of the transport score should sit on distance, with a smaller portion allocated to the vehicle type used for collection/haulage.
Ask for:
- KM travelled per waste stream
- Vehicle type used for collection/transport (e.g., electric vs diesel, and the declared vehicle standard where relevant).
Scoring approach: prioritise lower kilometres per stream, then use vehicle type as a secondary differentiator.
Block C: Circular outcomes and treatment transparency
This block focuses only on outcomes: what happens to each waste stream after collection. Ask every bidder to provide the same outcome split for each stream in scope, using your definitions.
Request per waste stream:
- % reused
- % recycled
- % recovered (for example energy recovery)
- % disposed (for example landfill)
Scoring approach: prefer higher recycling and lower disposal for the streams where that is realistic, and score bidders on the consistency and completeness of the outcome breakdowns across the full scope.
Block D: Added value
Keep this block qualitative and simple. Use it to capture what won’t show up in unit rates or kilometres but will affect day-to-day delivery and how smoothly the contract runs.
Sub-criteria could include:
- End-to-end service (onboarding, multi-site coordination, issue handling)
- Communication and escalation (responsiveness, clarity, single point of contact)
- Sustainability solutions (practical support to reduce contamination or improve segregation at sites)
- Support during tendering and onboarding (quality of assumptions, site visits where relevant, implementation plan)
Scoring approach: use a simple star rating (e.g., ★ below expectation, ★★ meets expectation, ★★★ above expectation).
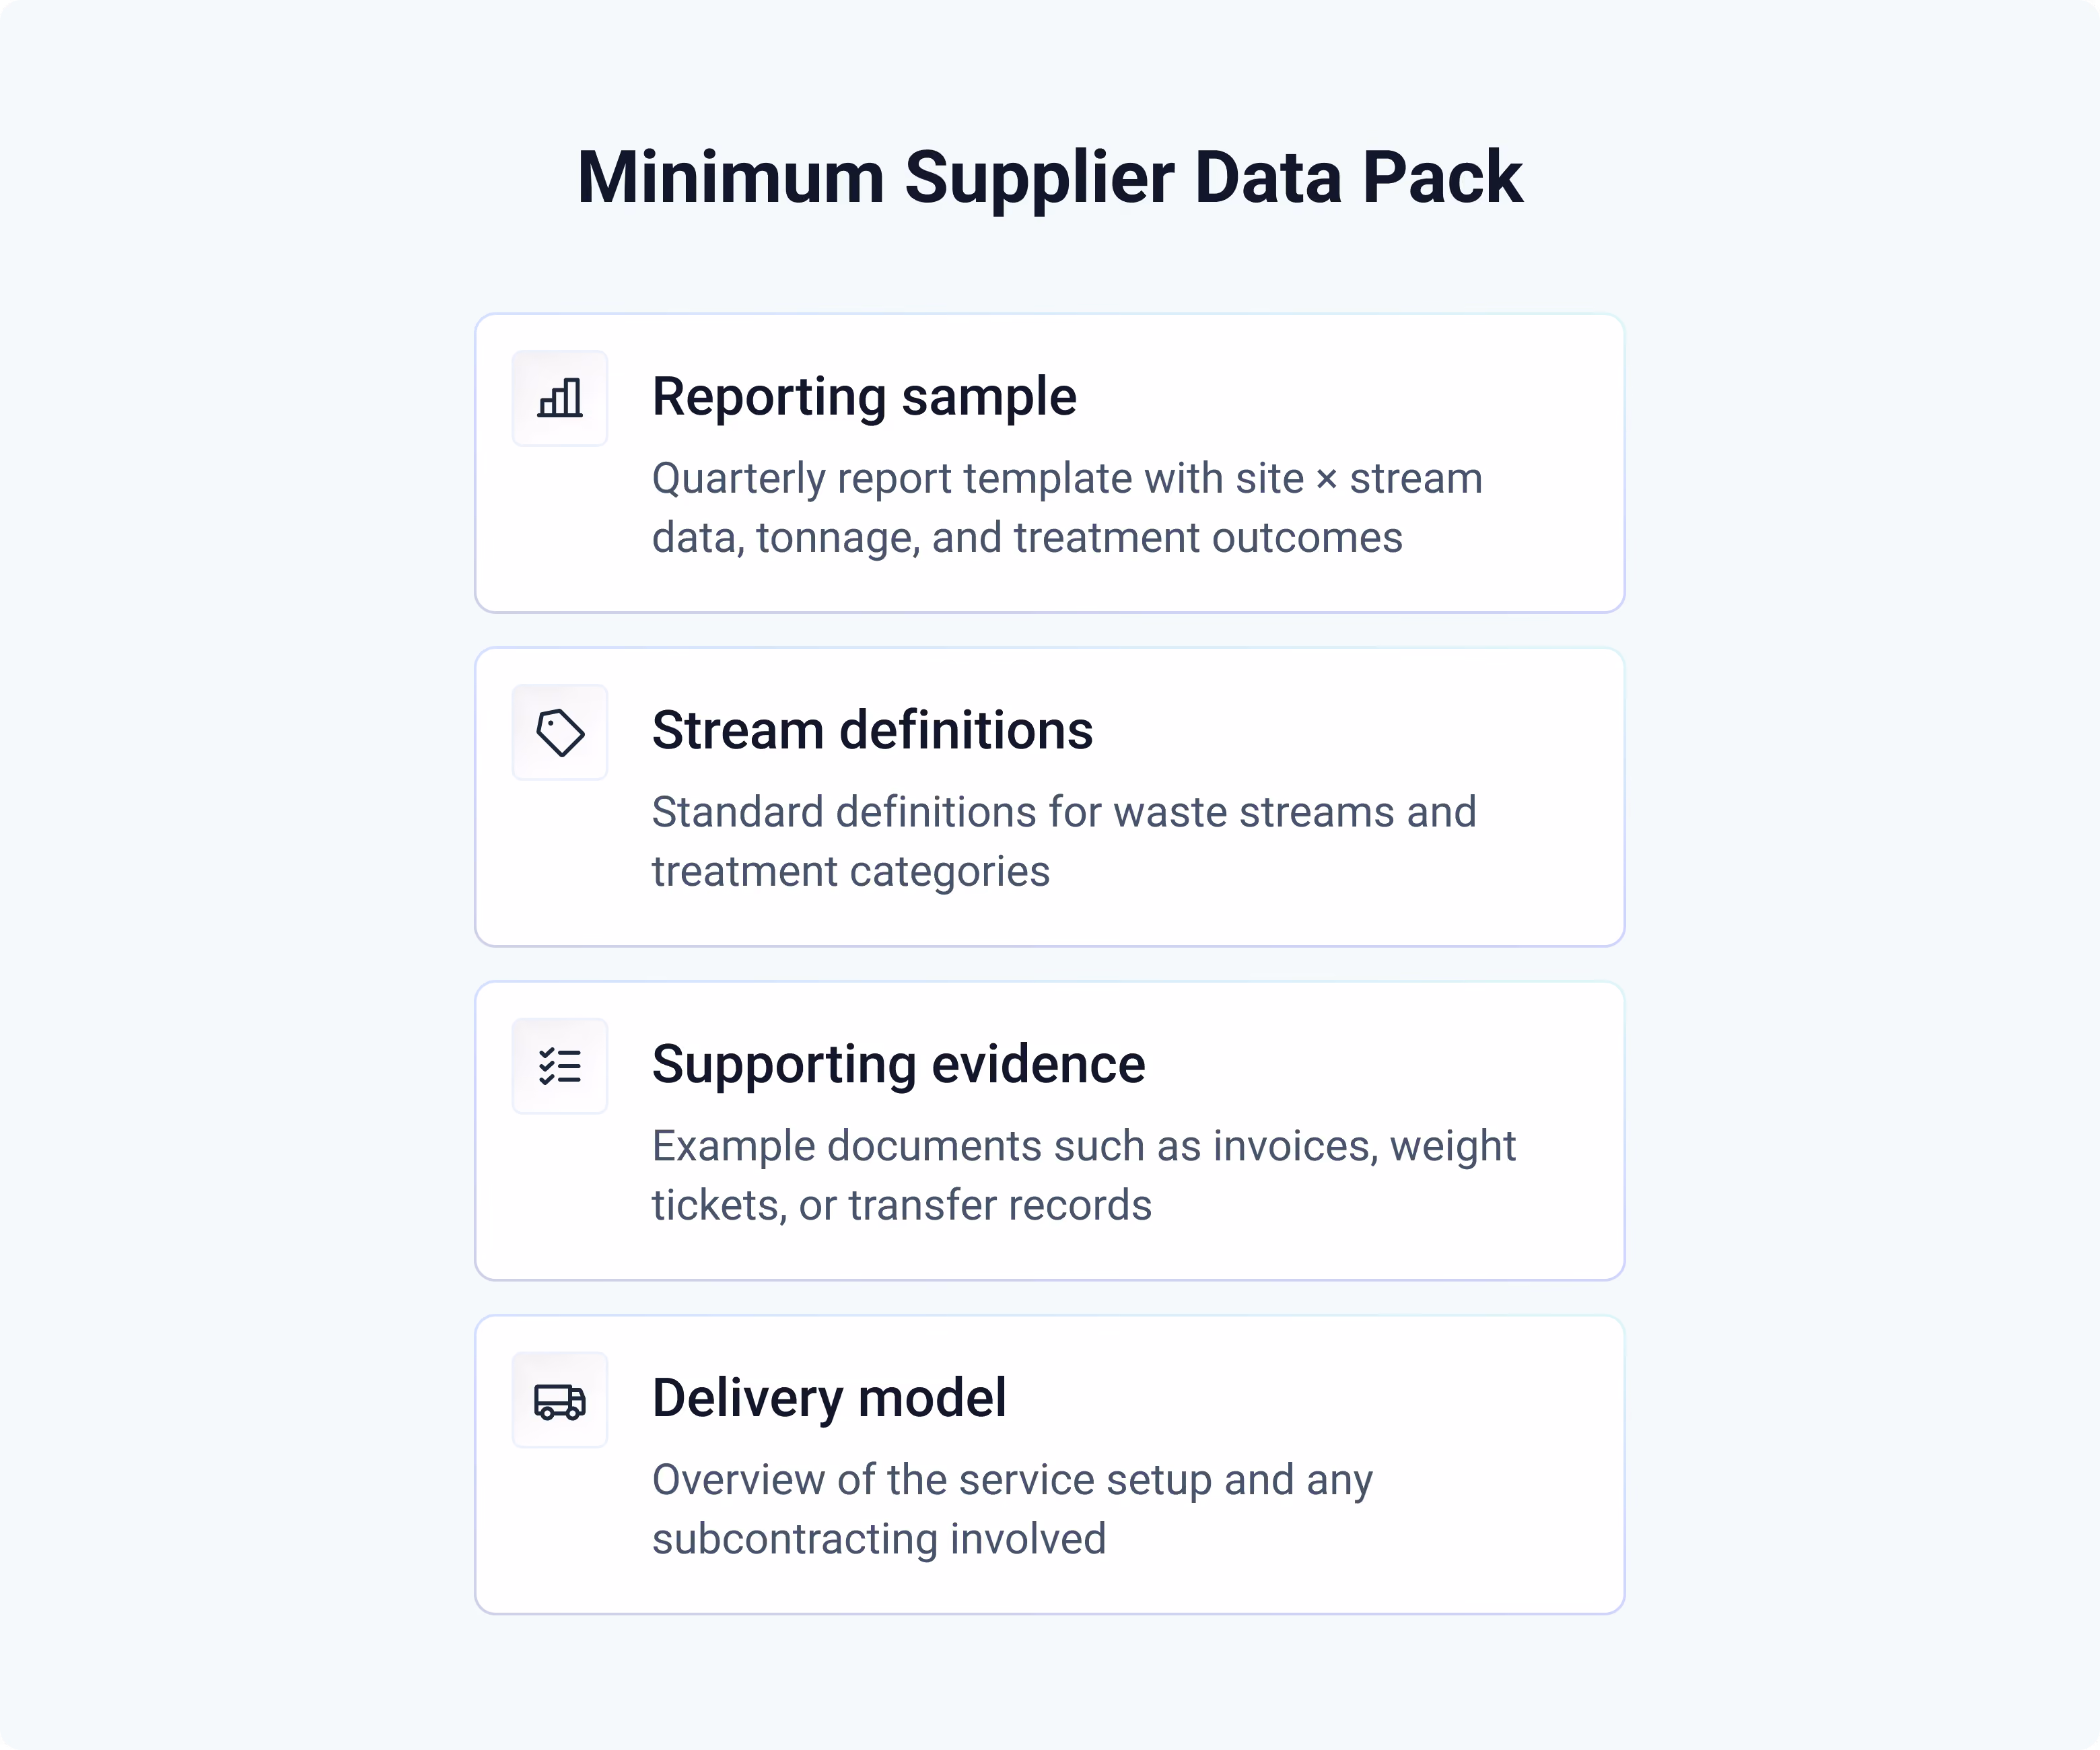
Require a minimum supplier data pack
A short “data pack” requirement improves bid quality because it forces every bidder to respond in the same structure. Keep it minimal and repeatable so it can be reused after award.
Ask every bidder to submit:
- One sample quarterly report in your template (site × stream), including tonnage (and collections if available) and the treatment outcome split for each stream.
- A definitions sheet for stream names/codes and treatment outcomes (so terms like recycling, recovery, and disposal are used consistently).
- Example supporting documents (anonymised is fine), such as an invoice, weight ticket, or transfer documentation example for at least one stream, to show what evidence is available.
- A delivery model statement, including whether any collection/haulage/processing steps are subcontracted and how that is managed.
Optional:
- An example of how missed collections, rejected loads, or contamination events are recorded and resolved.
This data pack also becomes the starting point for supplier governance after award, because it matches the reporting and evidence expectations you will manage against.
Put the matrix into the contract
The assessment matrix should translate directly into contract terms. The simplest way is to include a short annex that fixes definitions, reporting expectations, and the review cadence you will use during the contract.
Contract terms that make the matrix workable after award:
- Definitions annex: waste streams in scope (including hazardous/non-hazardous where relevant), treatment outcome definitions (recycled / recovered / disposed), and any site identifiers or coding needed for reporting.
- Reporting cadence and format: the template to be used, file format (e.g., Excel/CSV), delivery dates, and who signs off on the report.
- Evidence provision: what supporting documents can be requested (e.g., invoices, weight tickets, transfer documentation where applicable) and the expected response time for providing them.
- Route-change notification: when the supplier must notify you of changes that affect reported outcomes (for example a change in treatment route category for a stream).
- Subcontracting disclosure: whether subcontractors are used for collection/haulage/processing steps, and when changes must be communicated.
- Review cadence: a quarterly performance review using the same categories as the tender matrix (price drivers, transport, treatment outcomes, and service/added value topics), including an agreed list of actions.

This keeps tender scoring, reporting, and supplier governance aligned, so performance can be reviewed consistently over the contract term.
How the matrix supports circularity in practice
The matrix supports circularity by turning it into something procurement can select and manage. By scoring treatment outcomes per stream (% reused, % recycled, % recovered, % disposed), you reward suppliers whose operating model delivers higher reuse and recycling and lower disposal for the streams you generate.
After award, the matrix provides a repeatable way to manage improvement. The outcome splits show where performance is falling short and create a clear basis for corrective actions such as adjusting segregation guidance, container setup, collection routines, or supplier processes. Over time, this helps to stabilise stream quality and shift more material into higher-value treatment routes, with fewer surprises in cost and reporting.
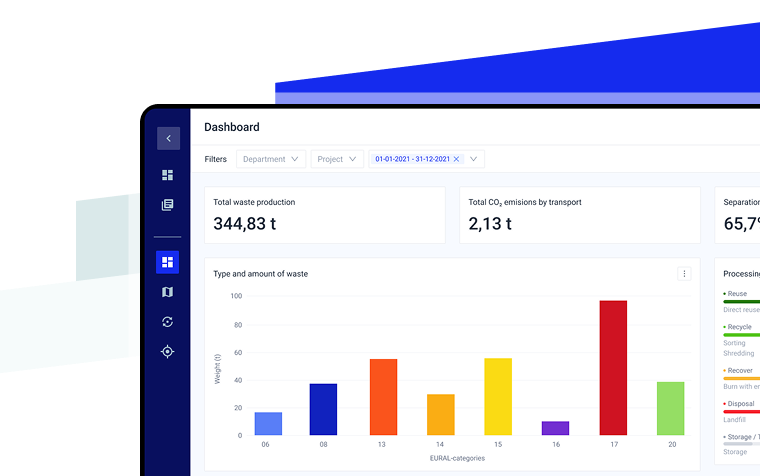
How geoFluxus Supports Procurement Decisions
This workflow only works if you know what your baseline is. Without a proper baseline, key streams can be missing or inconsistently defined, which then shows up as an unwelcome surprise once the contract starts.
geoFluxus helps procurement move from assumptions to evidence. It acts as a data and analytics layer for waste, materials, and circularity by:
- Establishing baselines by site, stream, and vendor
- Consolidating inputs from sites and contractors into one standardised dataset
- Linking figures to evidence through traceable records for internal review
- Highlighting operational drivers of weaker outcomes, such as mixed streams or inconsistent handling between sites
- Producing exportable outputs (clean Excel files and reporting views) for tenders and quarterly supplier reviews

If you want to explore how this fits into your reporting and procurement workflows, start with geoFluxus and the solutions pages for Compliance Reporting and Circularity Optimization. When you’re ready to see the data layer in a real environment, book a call today.
Conclusion
Using an assessment matrix gives procurement teams a clear way to select waste processors on outcomes that matter. Pass/fail gates keep unworkable bids out early, and four scoring blocks—price, transport, treatment outcomes, and added value—create a consistent basis for comparing suppliers across sites and streams. When the same definitions and reporting cadence are carried into the contract, quarterly reviews become straightforward: treatment outcomes can be tracked, operational issues can be addressed, and improvement actions can be followed over time. This makes it easier to contract for more sustainable choices from the start—higher recycling and recovery where feasible, lower disposal, and clearer accountability for the outcomes you expect.
FAQs
What is circular procurement?
Circular procurement is a purchasing approach that prioritises suppliers, products, and service models that keep materials in use longer and reduce waste through reuse, repair, take-back, refurbishment, and higher-value recovery.
What is the difference between sustainable procurement and circular procurement?
Sustainable procurement is broader (environmental, social, ethical criteria). Circular procurement is more specific: it focuses on material loops, waste prevention, and end-of-life outcomes.
How do I qualify suppliers for circular procurement in practice?
Start with 3–5 measurable criteria that fit the category (e.g., take-back rate, packaging composition, recycled content by material type, waste per unit delivered). Require evidence that can be repeated quarterly and compared across suppliers.
What data matters most for circular procurement decisions?
Stream-level data that’s consistent across sites: what materials come in, what waste streams come out, how they’re segregated, and which treatment routes are actually used.
How does circular procurement support CSRD reporting?
It supports CSRD when supplier selection and contract KPIs are tied to traceable, repeatable data—so value chain claims can be reviewed internally and defended if challenged.