“Over the years we’ve invested significantly in our field data team - focusing on producing trusted ratings. While this ensures the accuracy of our Ratings, it doesn’t allow the scale across the thousands of projects that buyers are considering.”

For more information on carbon credit procurement trends, read our "Key Takeaways for 2025" article. We share five, data-backed tips to improve your procurement strategy.
One more thing: Connect to Supply customers also get access to the rest of Sylvera's tools. That means you can easily see project ratings and evaluate an individual project's strengths, procure quality carbon credits, and even monitor project activity (particularly if you’ve invested at the pre-issuance stage.)
Book a free demo of Sylvera to see our platform's procurement and reporting features in action.
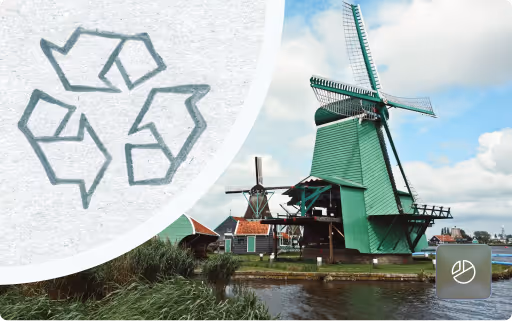
Why Measuring Circular Economy Progress Matters
Across Europe, the circular economy has become a central policy objective. Yet without robust indicators, circular economy targets risk remaining symbolic rather than operational. Many countries still rely on end-of-life metrics such as recycling rates, which capture what happens to waste but say little about upstream material use, product design, or the extraction of natural resources.
This creates a disconnect between ambition and reality. A country can improve its recycling statistics while continuing to increase demand for new raw materials through global supply chains. Negative externalities such as climate change, biodiversity loss, and resource scarcity remain hidden when measurement focuses only on waste outputs.
For policymakers, companies, financial institutions, and environmental organisations alike, the question is no longer whether a circular transition is desirable, but how to verify that material use, environmental damage, and strategic dependency are actually declining. The Dutch circular economy approach starts from this premise: progress must be measurable if a transition to a circular economy is to be credible.
Dutch Circular Economy Ambitions — Beyond Aspirations
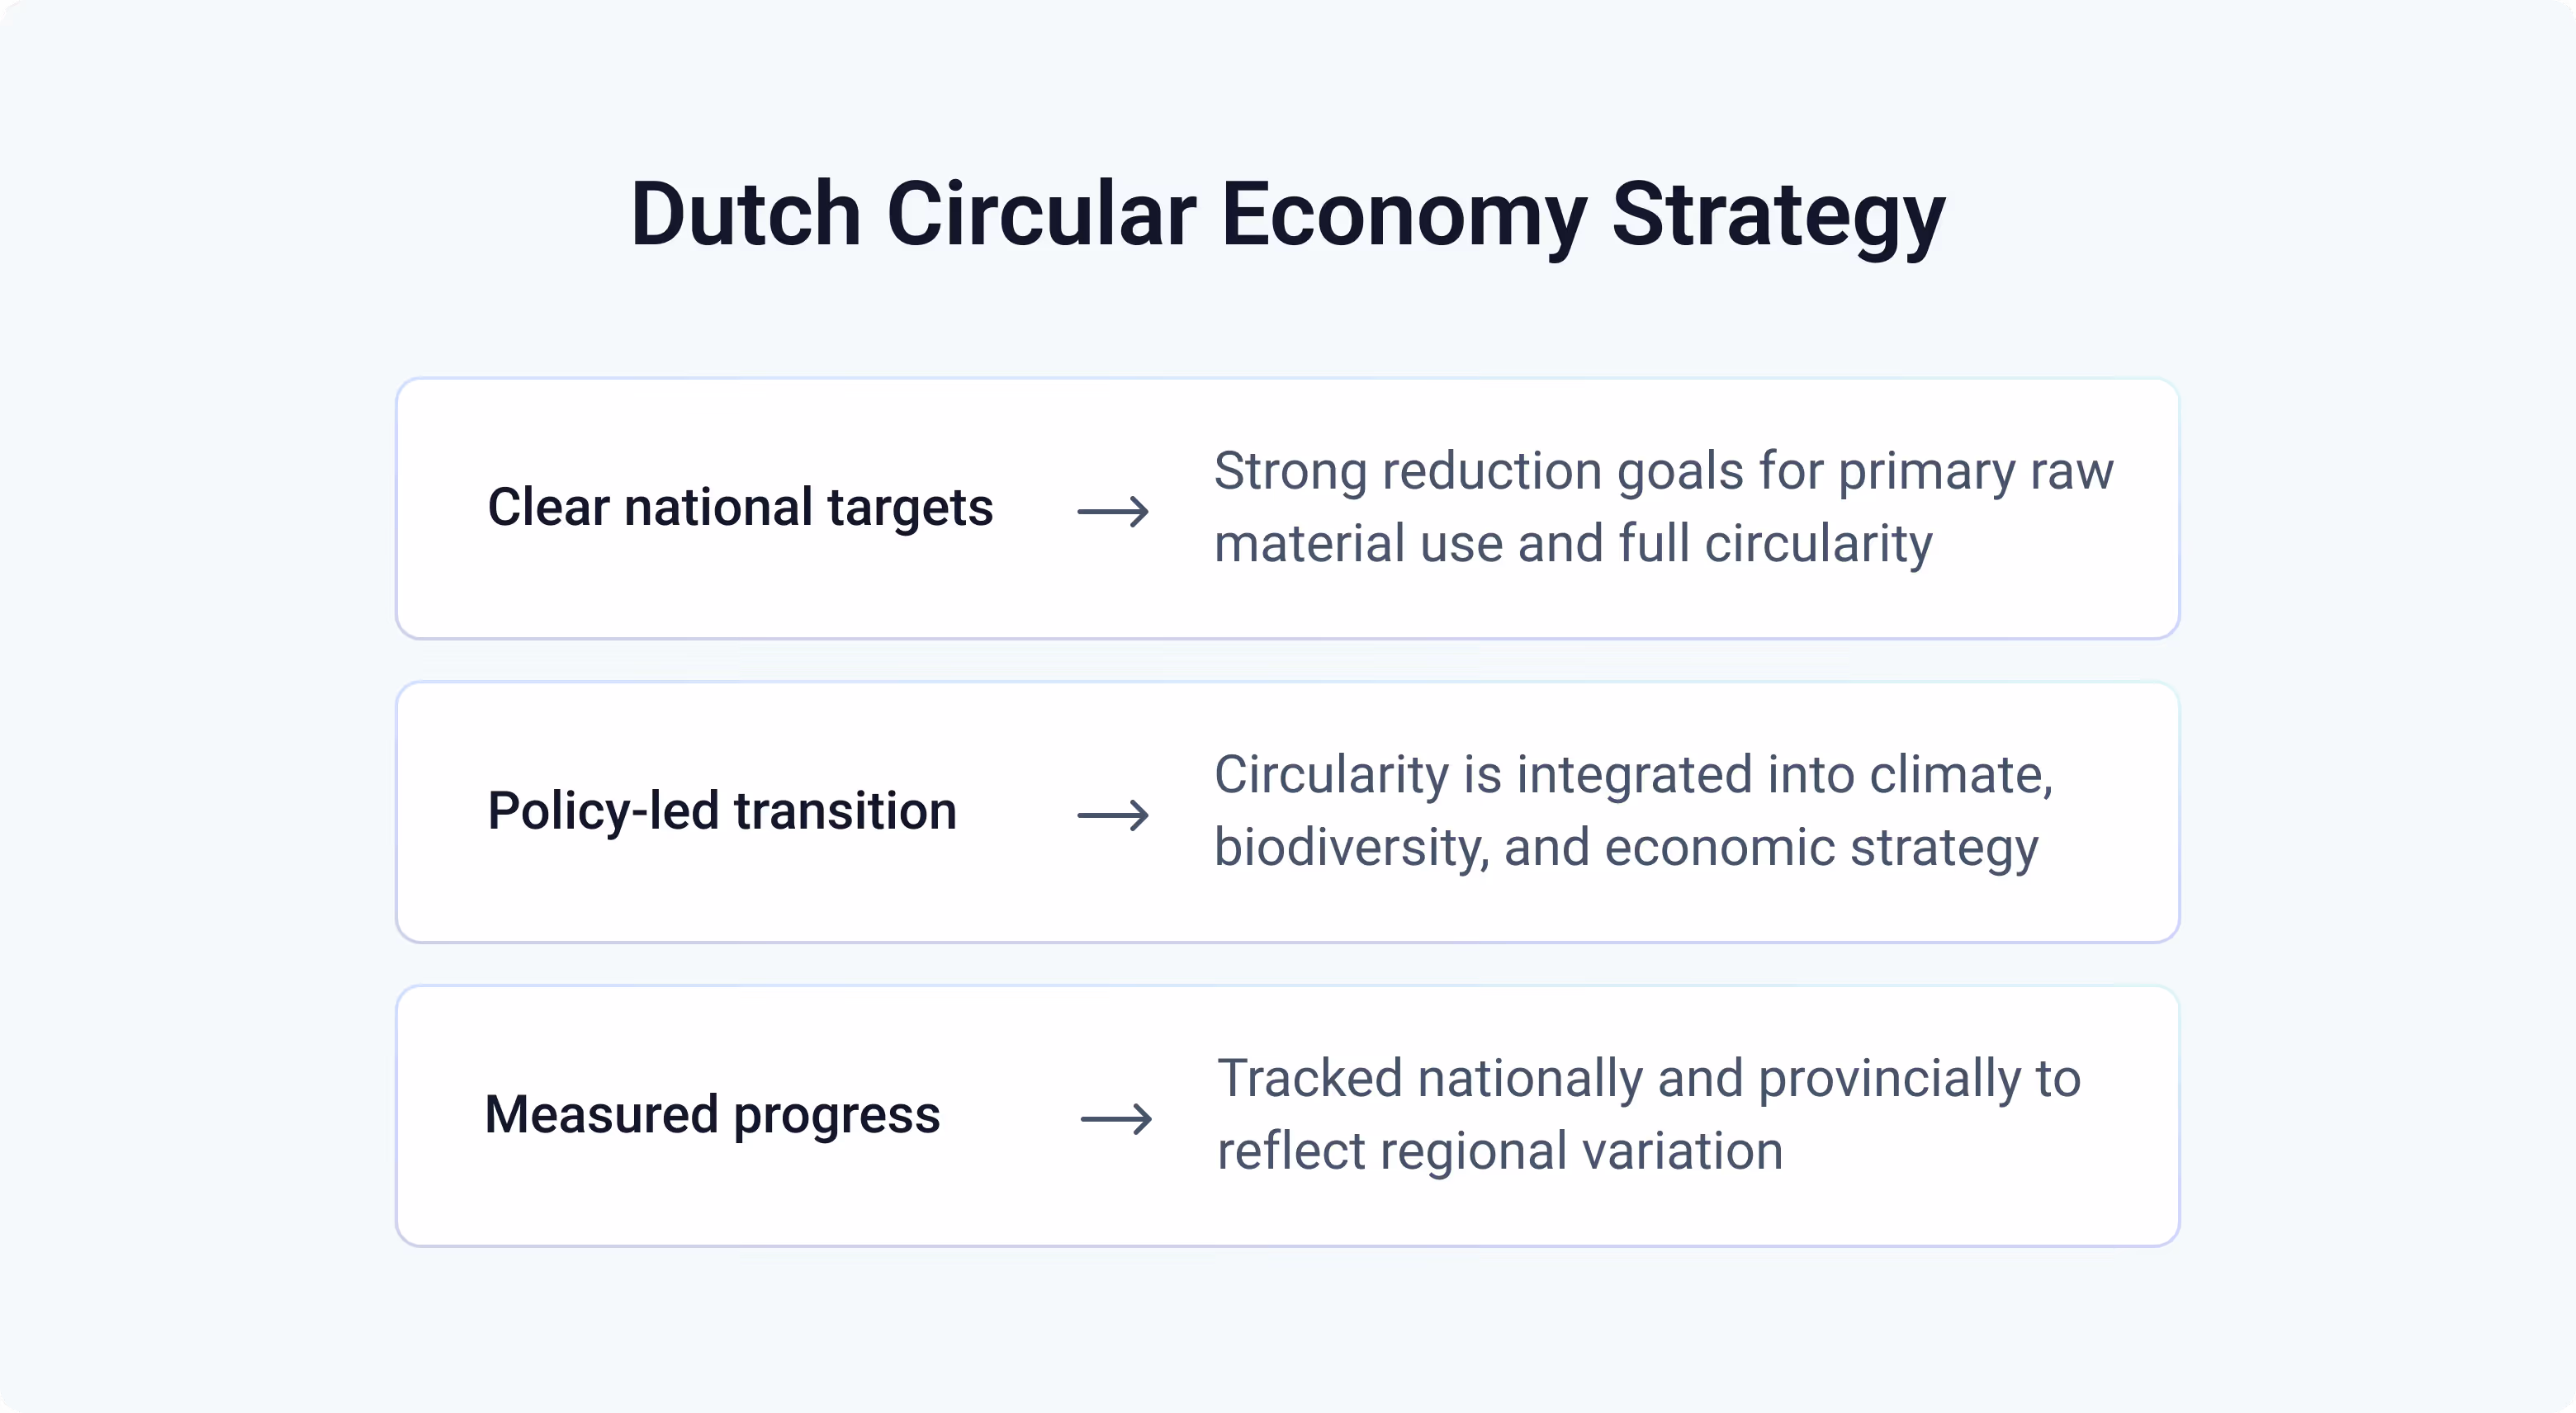
The Netherlands aims to become a fully circular economy by 2050, with a specific target of reducing primary raw material use by 50% by 2030. These goals are anchored in national policy and supported by an implementation programme that connects climate change mitigation, biodiversity protection, and long-term competitiveness of the Dutch economy.
The Dutch government positions the circular transition as a structural shift in how the economy produces, consumes, and reuses materials. Key sectors such as construction, consumer goods, food, manufacturing, and services are central to this transition, alongside transition agendas focused on plastics, biomass and bio-based materials, and critical raw materials.
What sets the Netherlands apart is that these ambitions are designed to be monitored. Rather than treating circularity as an abstract future state, the Dutch approach embeds measurement into policy design. Progress is assessed not only at national level, but increasingly at provincial level, recognising that industrial structure, production processes, and waste flows differ sharply across regions.
How the Netherlands Measures Circularity in Practice
The Netherlands operates one of the most detailed waste and material registries in the European Union. Mandatory reporting requirements, harmonised waste codes, and extensive processor data make it possible to trace material flows across the value chain, from production and consumption through to treatment and reuse.
Since January 2025, provinces have worked together with geoFluxus to access the data and figures needed for provincial circular economy monitoring. This collaboration enables material flows to be analysed across regional borders rather than within isolated administrative units. The geoFluxus circular economy platform connects provincial goods data with waste data, creating coherent material flow analyses that support both policy evaluation and corporate decision-making.
.avif)
Readers interested in exploring the state of the circular economy at regional level can access publicly available insights via monitorce.nl, where provincial material flow indicators are made transparent and comparable.
Want to monitor the circular economy of your own region? Request a demo to see how regional material flows can be translated into actionable insight.
The Metrics That Define the Dutch Model
The Dutch model relies on a combination of complementary indicators that together describe how circular the economy actually is.
Direct Material Input (DMI) vs. Raw Material Consumption (RMC)
Direct Material Input measures the materials that physically enter the Dutch economy through domestic extraction and imports. At provincial level, DMI can suggest stabilisation or even decline in material use, particularly in regions where heavy industry has contracted or efficiency gains have been achieved.
Raw Material Consumption tells a different story. RMC includes the raw materials embedded in imported consumer goods, construction materials, and intermediate products. It reveals the global material footprint of Dutch consumption and exposes how environmental pressure is often shifted abroad rather than eliminated.
This distinction is essential. Provinces may reduce domestic material use while raw material consumption continues to rise, highlighting the offshoring of environmental impact through international value chains. Without RMC, the true scale of resource use would remain obscured.
.avif)
Environmental Cost Indicator (Eco-cost)
The Environmental Cost Indicator assigns a monetary value to environmental harm associated with materials and waste streams. It captures impacts such as emissions, toxicity, and depletion of natural resources, making it possible to compare very different materials on a common basis.
Eco-cost shows why volume alone is a poor indicator of circularity. Two product groups with the same tonnage can have radically different impacts on the environment depending on their production paths. For example, a litre of regular milk and a litre of oat-based milk may serve the same purpose as a food product and yet have radically different eco-cost. By translating environmental damage into economic terms, eco-cost enables circular procurement decisions and supports investment choices that account for long-term sustainable benefits.
This approach aligns circular economy policy with financial decision-making, making environmental impact visible to companies, governments, and civil society organisations alike.
Security of Supply and Critical Raw Materials
Security of supply is a crucial aspect to a circular economy. Using trade data and dependency analysis, government assesses how exposed key sectors are to disruptions in access to critical raw materials.
.avif)
Sectors such as automotive manufacturing, construction, and advanced consumer goods depend heavily on scarce or geopolitically sensitive materials, including fossil fuels and strategic metals. Circular strategies such as reuse, remanufacturing, and substituting raw materials with recycled materials or bio-based alternatives are therefore framed as measures to reduce systemic risk, not only as sustainability initiatives.
This perspective positions the circular economy as part of industrial resilience policy rather than a standalone environmental agenda.
What These Metrics Reveal About Circularity in the Netherlands
Taken together, these metrics paint a far more nuanced picture of circular progress than recycling rates alone. Circularity looks very different depending on whether domestic material flows or embedded global impacts are considered.
Provincial differences are pronounced. Regions with dense industrial clusters and specialised processing infrastructure often have more efficient ways to retain material value than areas with limited facilities. Environmental impact is driven more by material composition, production processes, and treatment routes than by waste volume alone.
.avif)
As a result, circular economy policy increasingly overlaps with industrial strategy, innovation policy, and long-term economic planning. The circular transition is not only about waste reduction, but about reshaping demand, product design, and supply chains across the Dutch economy.
Why Provincial Monitoring Changes the Conversation
National averages hide the structural differences that determine whether circular initiatives succeed or fail. Provincial monitoring makes these differences visible and allows policymakers to identify where circular business models are realistic, where infrastructure gaps exist, and where targeted intervention is required.
This enables more precise policy design, avoids one-size-fits-all measures, and supports learning between regions facing similar challenges. It also strengthens accountability by clarifying which factors drive progress and which continue to hinder the transition.
Conclusion — Circular Economy Progress Starts With Measurement
Leadership in the circular economy is defined less by ambition than by measurement. By combining material flow analysis, environmental cost valuation, and security of supply indicators, the Netherlands has developed a framework that captures the complexity of a transition to a circular economy.
Metrics such as Raw Material Consumption, eco-cost, and dependency on critical resources reveal impacts that recycling rates alone cannot. As other countries move toward circular-economy targets by 2050 and align with European Union and United Nations frameworks, the Dutch model offers a practical blueprint for turning ambition into measurable progress toward a sustainable, circular future.
Want to monitor the circular economy of your own region? Request a demo to see how regional material flows can be translated into actionable insight.
FAQs
Is the Dutch circular economy model relevant for other countries?
Yes. While the Netherlands benefits from detailed data infrastructure, the underlying approach — combining material flows, environmental cost indicators, and supply risk analysis — can be adapted by other countries. The model demonstrates how circular economy policy can be grounded in measurable system performance rather than high-level targets alone.
How does this approach support European circular economy goals?
The Dutch measurement framework aligns with broader European Union objectives around resource efficiency, climate mitigation, and strategic autonomy. By making material use and environmental impact transparent, it supports evidence-based policymaking and more robust reporting under emerging EU sustainability frameworks.
What is the difference between Direct Material Input (DMI) and Raw Material Input (RMI)?
DMI measures the physical materials entering an economy through domestic extraction and imports. RMI includes the raw materials embedded in imported goods, revealing the full global footprint of consumption. In the Netherlands, this distinction shows how domestic material use can decline while global extraction linked to Dutch demand continues to rise.
What role does the Environmental Cost Indicator (Eco-cost) play in circular economy monitoring?
Eco-cost assigns a monetary value to environmental damage such as emissions, toxicity, and resource depletion. It allows different materials to be compared based on impact rather than volume alone, supporting more informed policy, procurement, and investment decisions.
How does circular economy monitoring relate to security of raw material supply?
Dutch monitoring includes indicators that assess dependency on critical and strategic raw materials. This helps identify risks for key sectors such as manufacturing and construction and frames circular strategies like reuse and remanufacturing as measures to reduce supply chain vulnerability, not only environmental impact.