“Over the years we’ve invested significantly in our field data team - focusing on producing trusted ratings. While this ensures the accuracy of our Ratings, it doesn’t allow the scale across the thousands of projects that buyers are considering.”

For more information on carbon credit procurement trends, read our "Key Takeaways for 2025" article. We share five, data-backed tips to improve your procurement strategy.
One more thing: Connect to Supply customers also get access to the rest of Sylvera's tools. That means you can easily see project ratings and evaluate an individual project's strengths, procure quality carbon credits, and even monitor project activity (particularly if you’ve invested at the pre-issuance stage.)
Book a free demo of Sylvera to see our platform's procurement and reporting features in action.
Why Route Optimization Is the Next Frontier in the Waste Management Industry
For most enterprises, waste transport remains a black box. Processors manage waste collection operations, including household waste subcontractors, and waste collection vehicles, while companies and their customers see only the final report — not the distance travelled or the emissions produced.
Research into national waste management systems shows that even in well-documented registries, visibility stops once waste leaves the site. A single waste collection route can cover tens or even hundreds of kilometres before treatment, generating measurable CO₂ with every trip.
This matters because sustainability frameworks like CSRD and ISO 14064 now expect businesses to report and verify transport-related emissions. Without access to data on routes, miles driven, fuel costs or vehicle utilisation, these Scope 3 figures remain rough estimates — making waste management transport one of the most underreported contributors to emissions and operational efficiency.
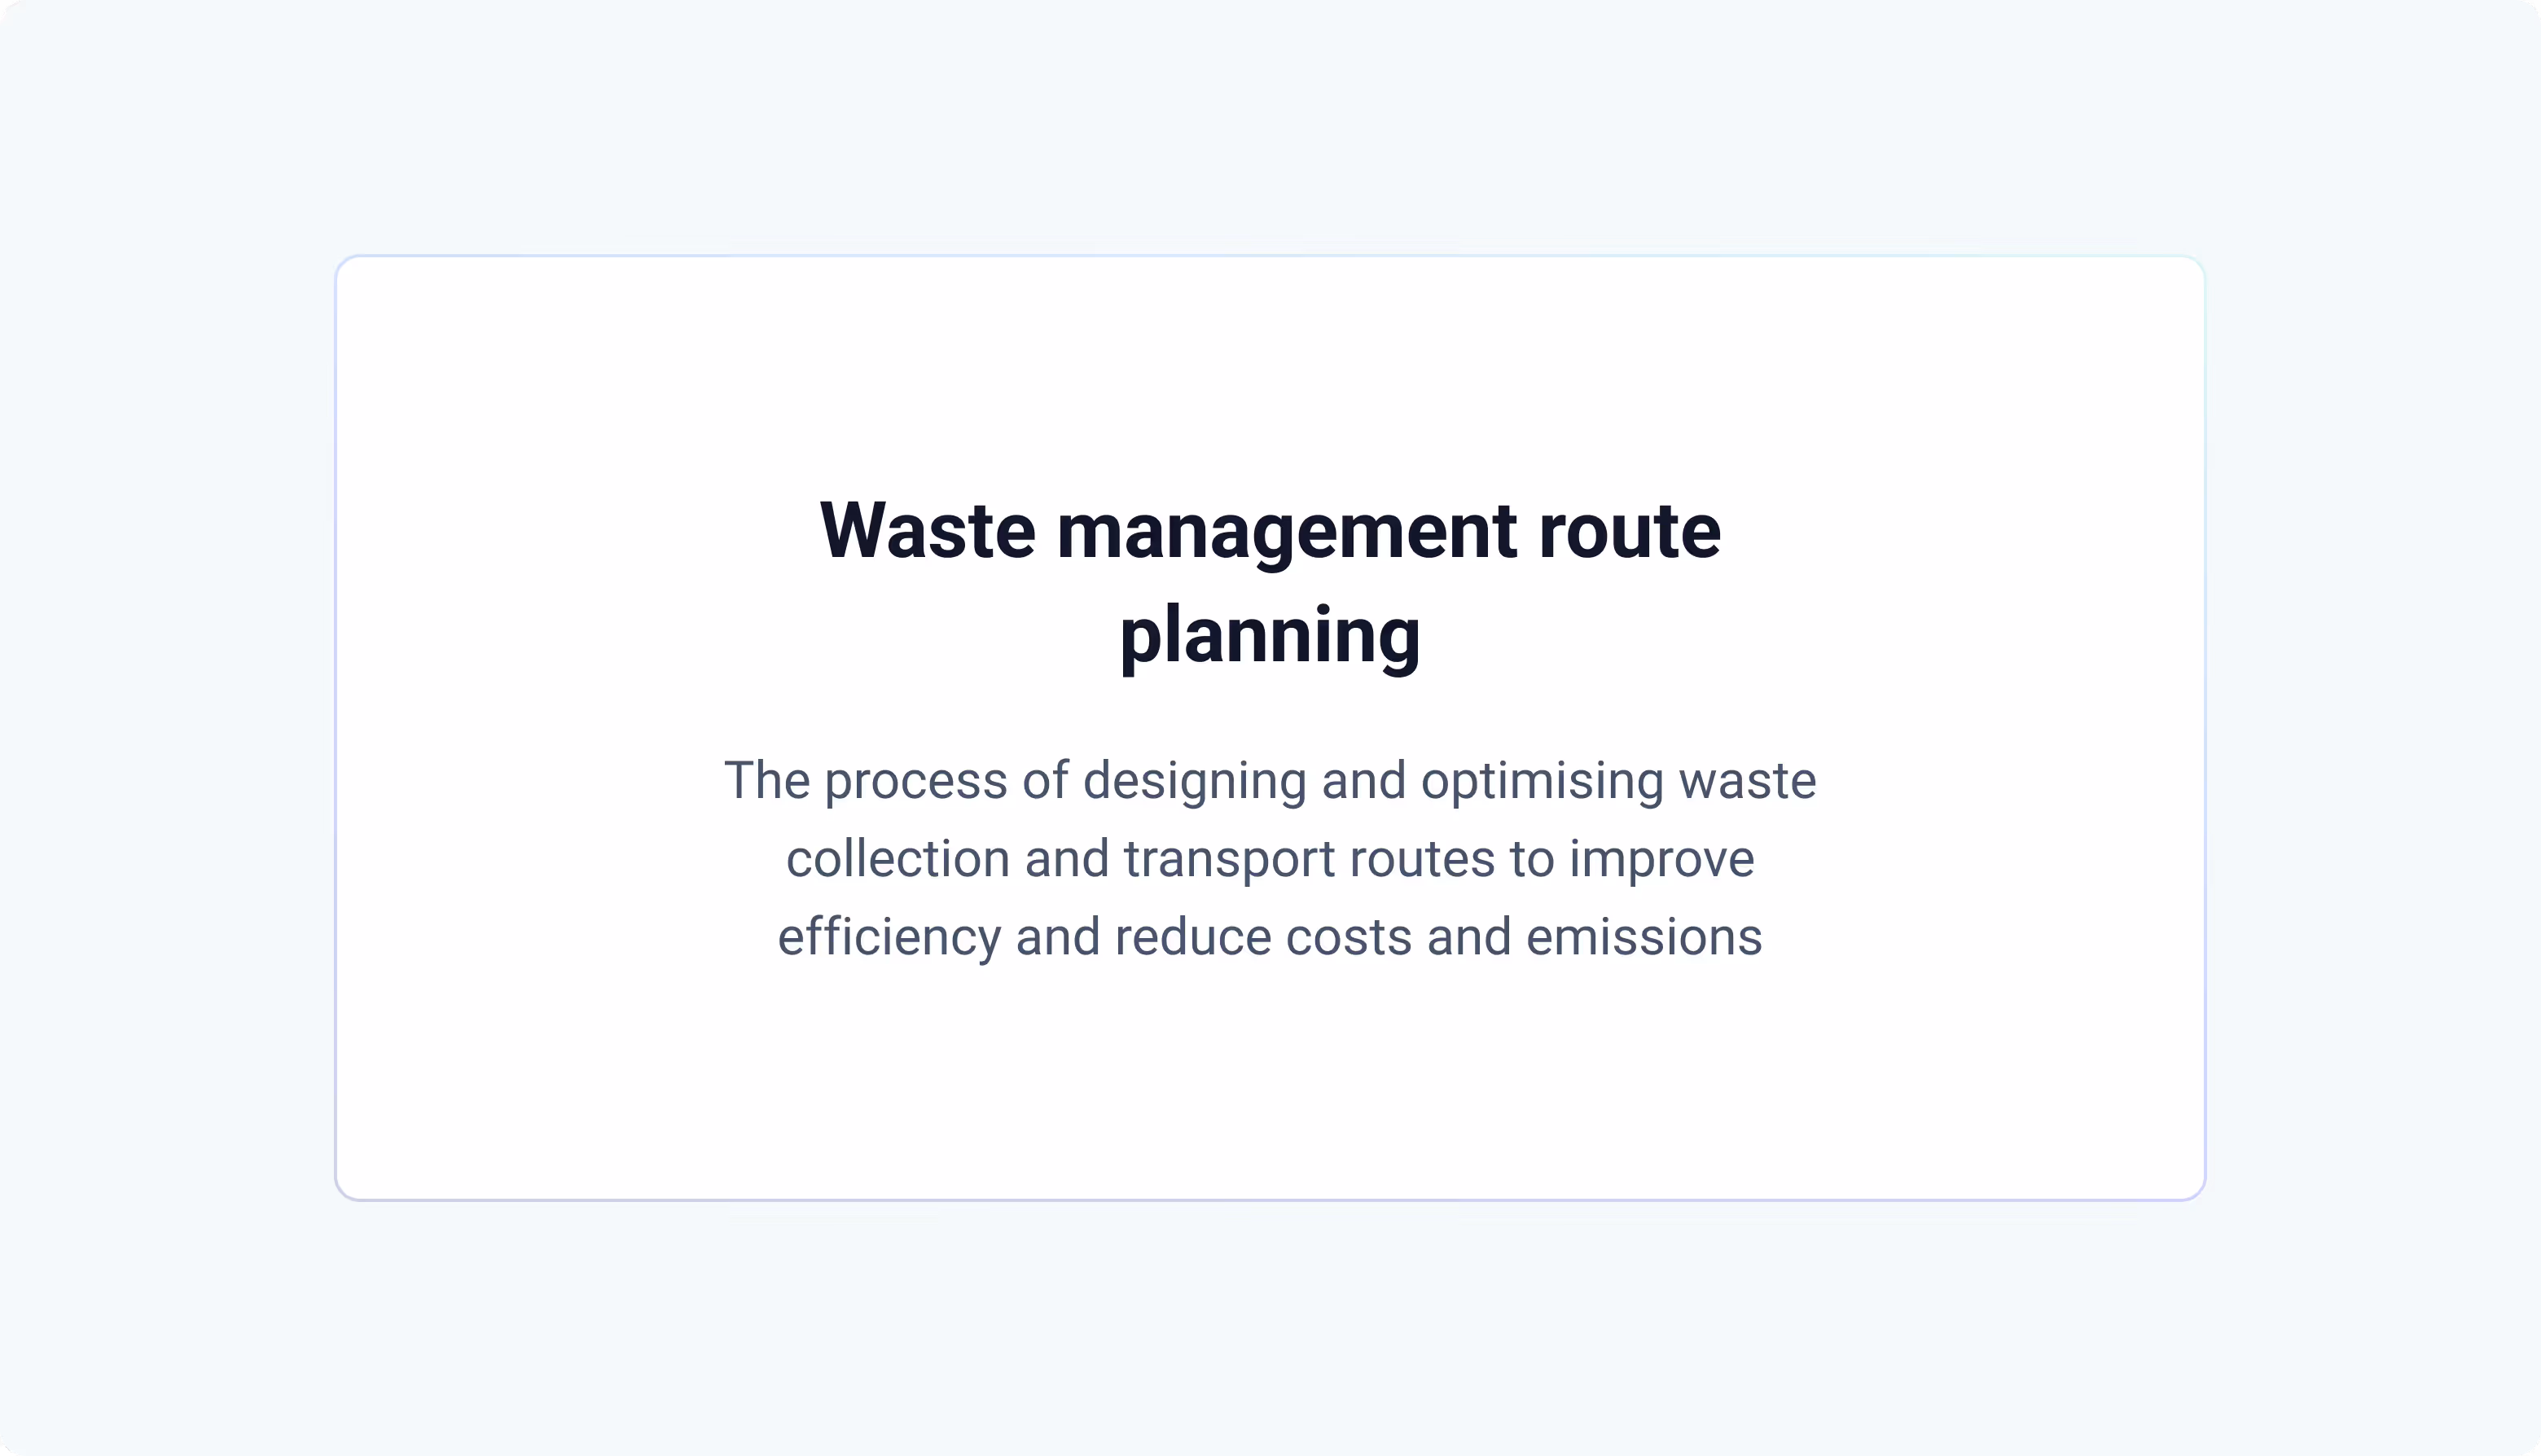
What Is Waste Management Route Planning and Why Does an Efficient Waste Collection Route Matter?
Waste management route planning is the process of designing the exact journey a waste collection vehicle takes — from pickup to transfer stations to treatment. It includes all collection points, routes, stops, and vehicle schedules. This task is handled by waste collection companies and their logistics partners, with their own waste management routing software.
Still, it plays a crucial role in corporate sustainability. Even if an enterprise doesn’t plan the trucks, it does choose where waste is processed — a decision that defines how far it travels and how much CO₂ is produced. With access to geospatial data such as pickup and treatment locations, organisations can estimate transport distances, calculate emissions, and make smarter procurement decisions that align with existing operations, ultimately boosting customer satisfaction.
3 Key Things to Keep in Mind When Wanting to Reduce Waste Transport Emissions
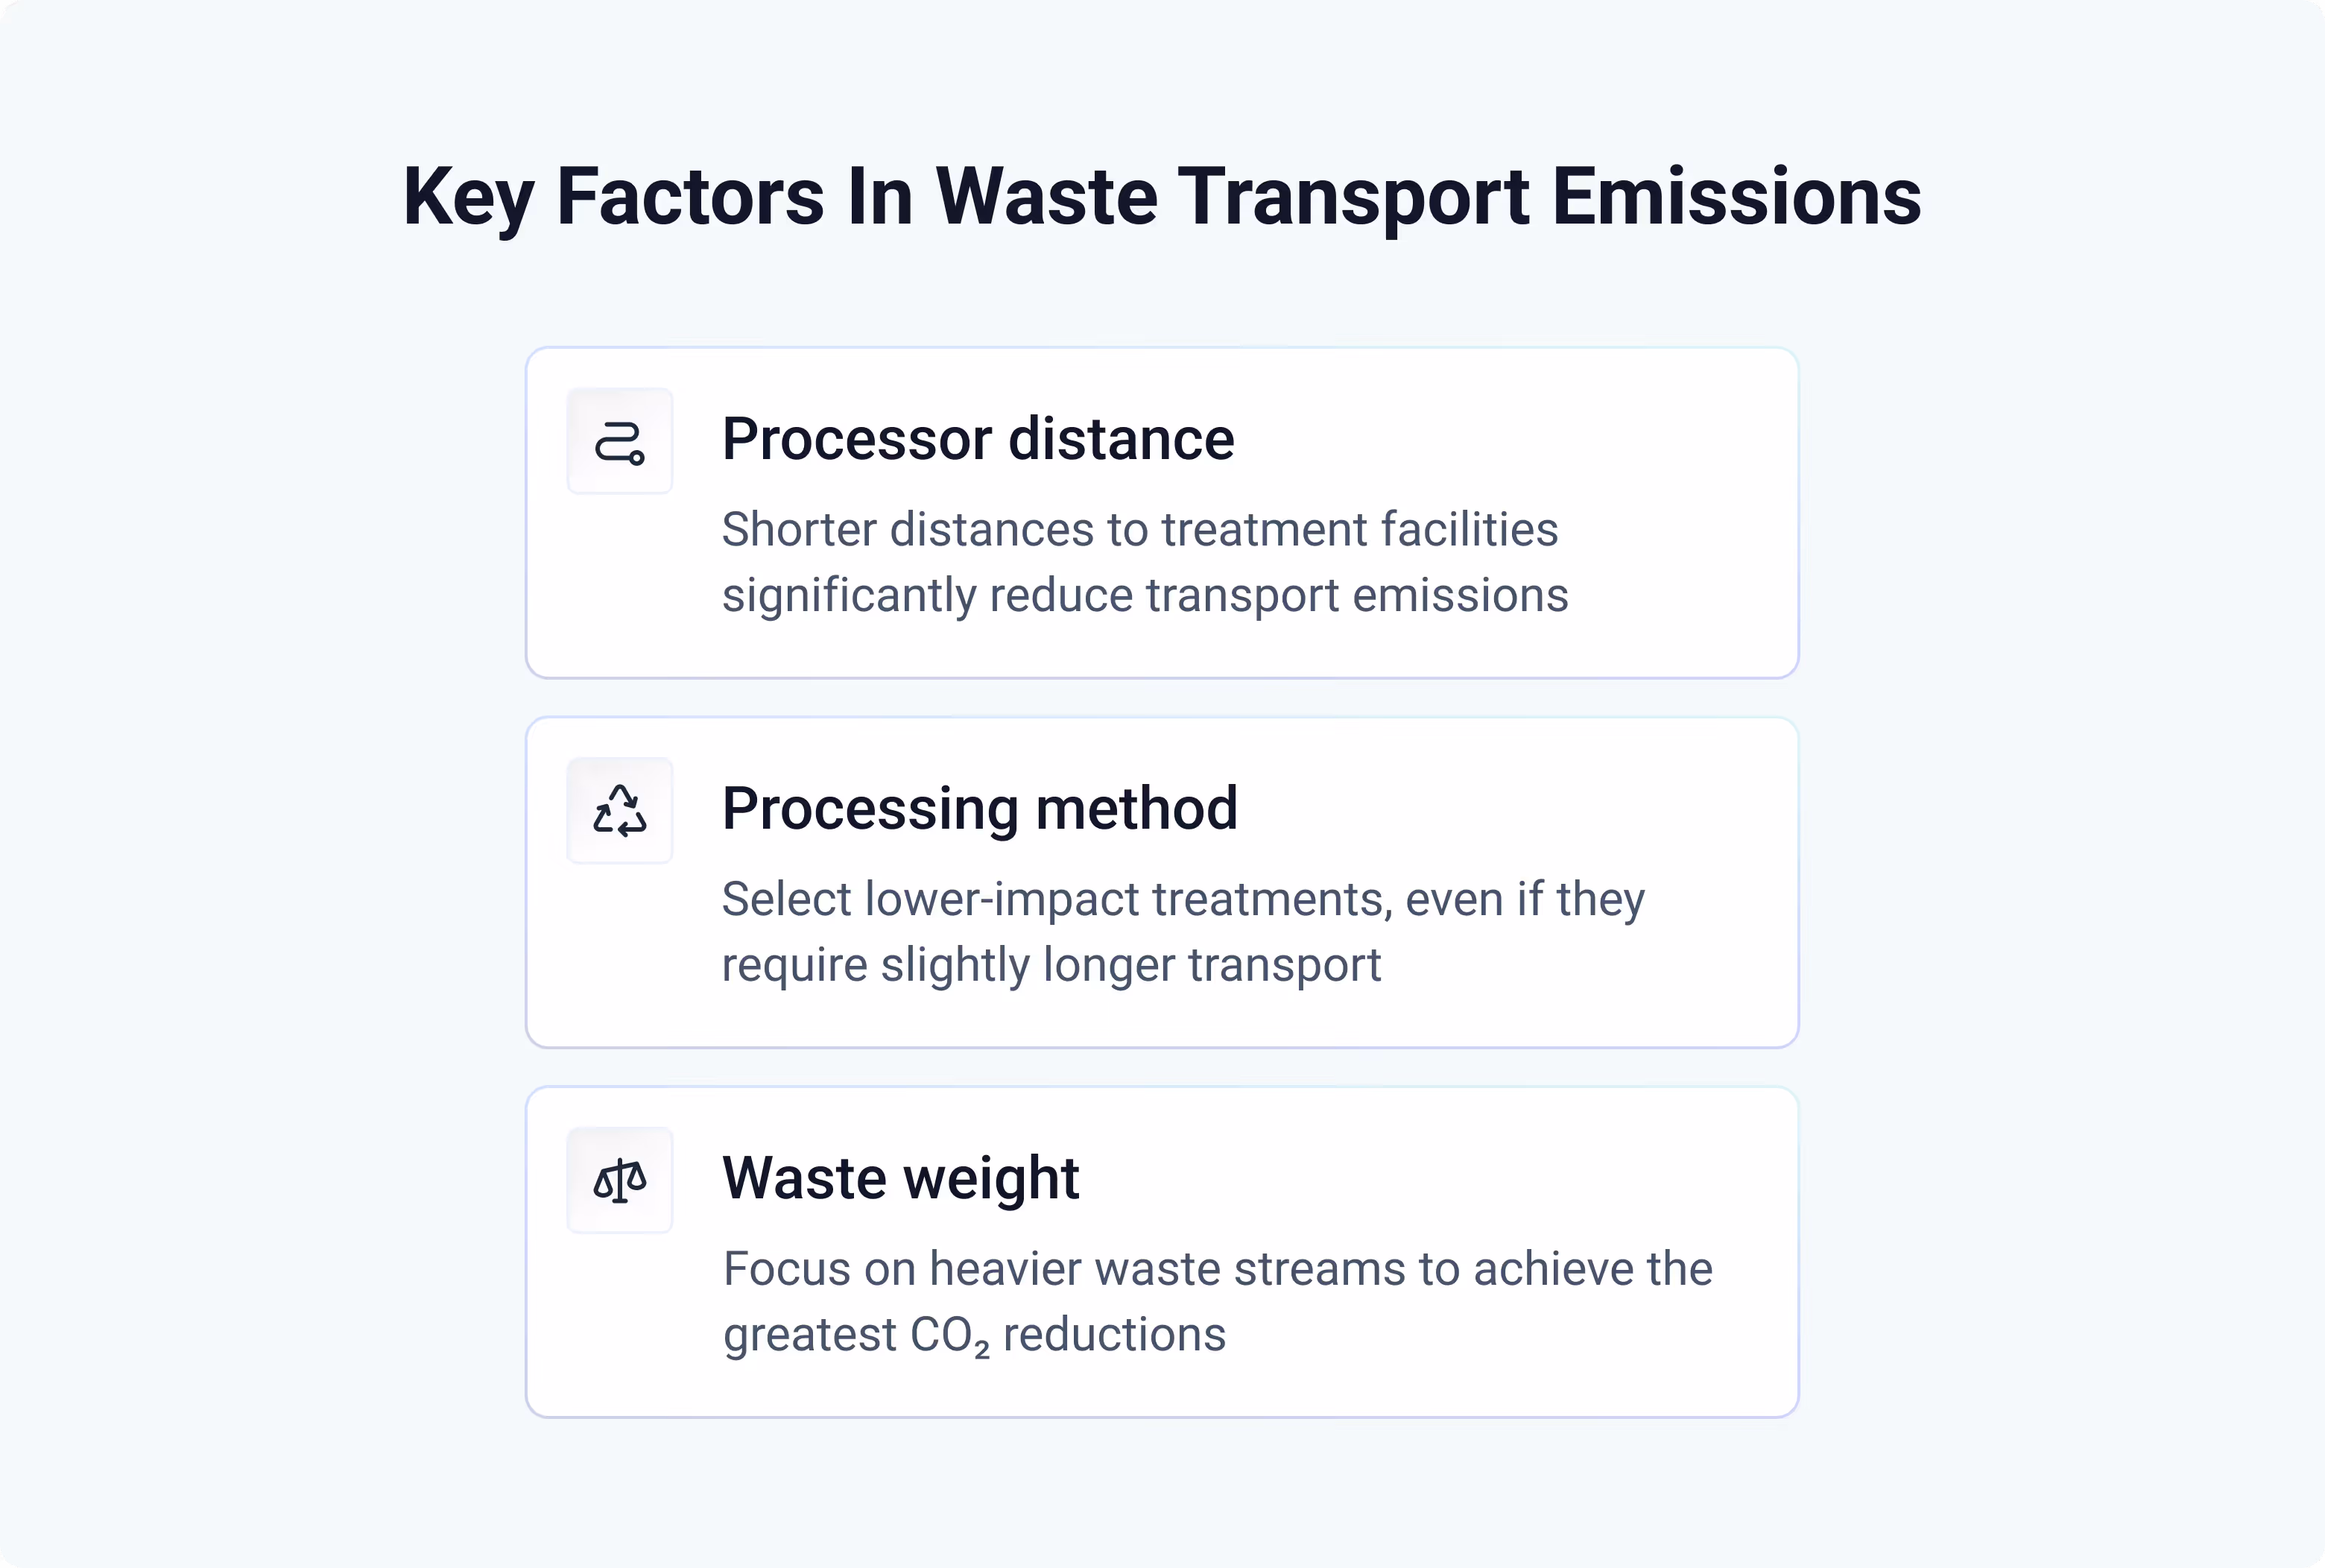
1. Processor Distance
The most influential factor affecting transport emissions is the distance between the waste generation site and the processing facility. Choosing processors closer to where the waste is produced can drastically cut CO₂ emissions from transport and better utilize vehicle capacity. Whenever possible, prioritise local treatment options — especially for waste streams that are collected frequently or in large volumes.
2. Processing Method
Distance alone doesn’t tell the full story. The environmental performance of the treatment method itself also matters. For instance, if your recyclable waste is processed 100 km away, but a plant only 20 km away would incinerate it for energy recovery, recycling at the farther distance is still the better choice. Even with longer transport, recycling generally leads to lower overall environmental impact and supports circularity.
3. Weight of Transported Waste
The heavier the waste, the higher the emissions from transport. Materials such as rubble, soil, and concrete contribute disproportionately to CO₂ output due to their mass and density. To make the biggest impact, start by targeting the heaviest waste streams and ensuring that your resources are optimally allocated . Optimising routes and locating nearby processors for these materials can significantly lower total transport emissions.
How Route Optimisation Reduces Waste Transport Emissions
Efficient routing directly reduces the carbon footprint of waste transport. Research across Europe, including detailed analysis in the Netherlands, shows that optimized routes, supported by real time data, can eliminate thousands of unnecessary kilometres travelled each year, saving fuel and emissions without changing how waste is treated.
The Impact of Distance and Routing
In the Amsterdam Metropolitan Area (AMA), the average waste disposal journey is around 60 kilometres, producing roughly 52 kilograms of CO₂ per trip. Collectively, waste transport linked to collection and treatment in the city generates around 167,000 tonnes of CO₂-equivalent annually.
Most of these emissions stem from a familiar problem: waste travelling farther than necessary. Side roads, fragmented collection routes and smaller vehicle trips — often used for mixed or low-volume waste streams — produce disproportionately high emissions per tonne compared to consolidated or optimised routes.
Proven Reductions Through Smarter Collection Routes
The AMA study, which combined national waste registry data with road networks and emission factors (from CE Delft’s STREAM Freight model), showed that shortening average travel distances or consolidating smaller trips through dynamic routing could reduce total transport emissions by 10–20% — without altering the underlying waste treatment methods.
Lessons from Europe
Similar trends appear across Europe, revealing how treatment location and route visibility play a decisive role in total emissions:
- Belgium (Ghent region): Organic and residual waste often move short distances between municipalities, yet frequent small trips by lighter vehicles still make transport one of the main contributors to the sector’s carbon footprint.
- Italy (Trento) and Spain (Bilbao): Construction and demolition waste is often hauled across provincial borders due to limited local capacity, resulting in thousands of avoidable tonne-kilometres each year.
- Poland and Germany: Regional planning data shows long-distance shipments to centralised facilities — especially for mixed industrial waste streams — remain common. Cross-border transfers further inflate transport emissions, often without being fully captured in national reporting.
Across all these cases, the message is consistent: distance, routing, and treatment location matter more than collection frequency or vehicle type when it comes to cutting transport-related emissions. Focusing on these parameters offers one of the fastest, most practical routes to measurable climate impact in waste logistics.
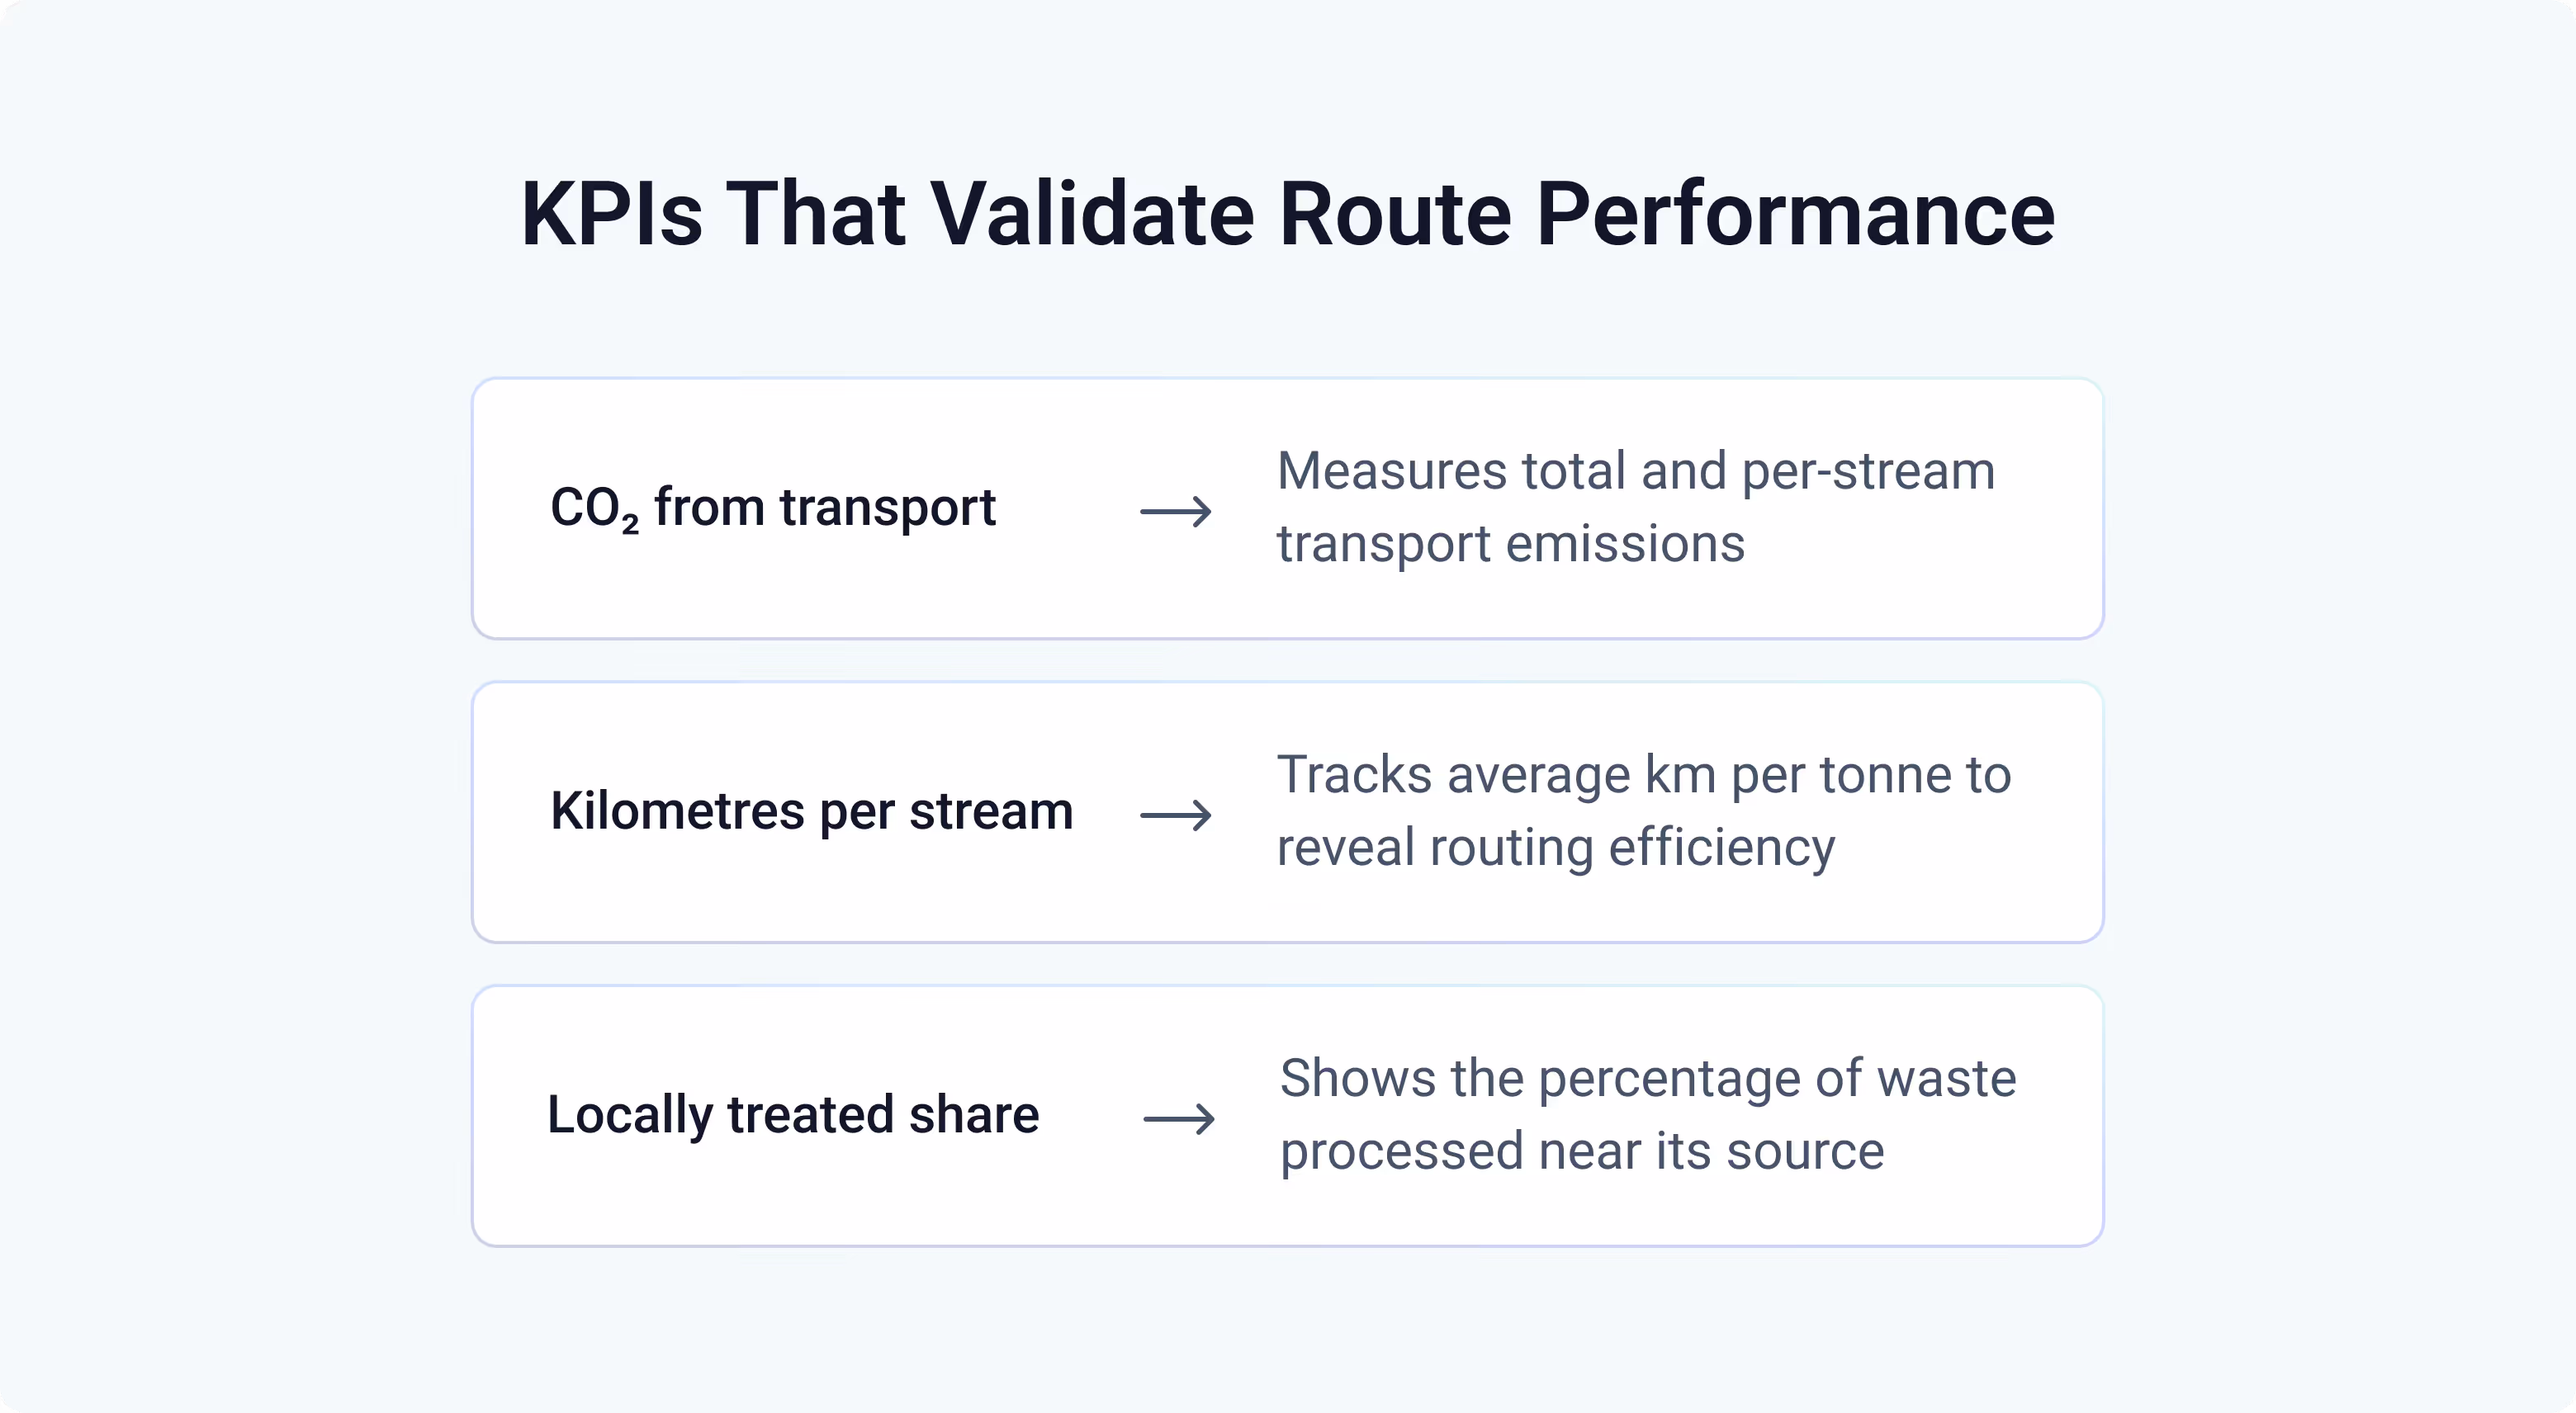
KPIs That Prove Your Route Planning Strategy Works
Once transport and treatment data become visible, you can start measuring what used to be a blind spot: the emissions and efficiency of their waste logistics. These three indicators provide a good overview of your overall route performance.

1. CO₂ Emissions from Transport (Total and by Stream)
The most direct measure of environmental impact. Calculating total transport emissions — and breaking them down per location, material type, or waste stream — shows where the largest contributors sit within your data.
2. Kilometres Driven per Waste Stream
Tracking the average kilometres travelled per tonne for each waste stream reveals routing efficiency. It highlights where waste is being transported further than necessary and where closer treatment options could lower both distance and emissions. Over time, declining figures indicate better processor alignment and reduced transport intensity.
3. Share of Locally Treated Waste (%)
A key circularity indicator showing the proportion of waste processed within a defined regional radius (for example, 50 km from the point of generation). Increasing this share means more materials are treated close to source — reducing emissions and reinforcing the proximity principle in waste management.
The Role of geoFluxus in Waste Logistics & Route Planning
Before geoFluxus became a platform, it began as a research project built around a single question: where does waste actually go?
Mapping those movements revealed what few organisations had ever seen clearly: waste doesn’t disappear after collection — it moves through a complex geography of transfer stations, treatment plants, and borders. Every kilometre travelled adds both cost and carbon, yet most of these journeys remain invisible in traditional reporting.
That research became the foundation of geoFluxus. It’s in our DNA: seeing waste not as a static number, but as a dynamic system that can be measured, optimised, and improved.
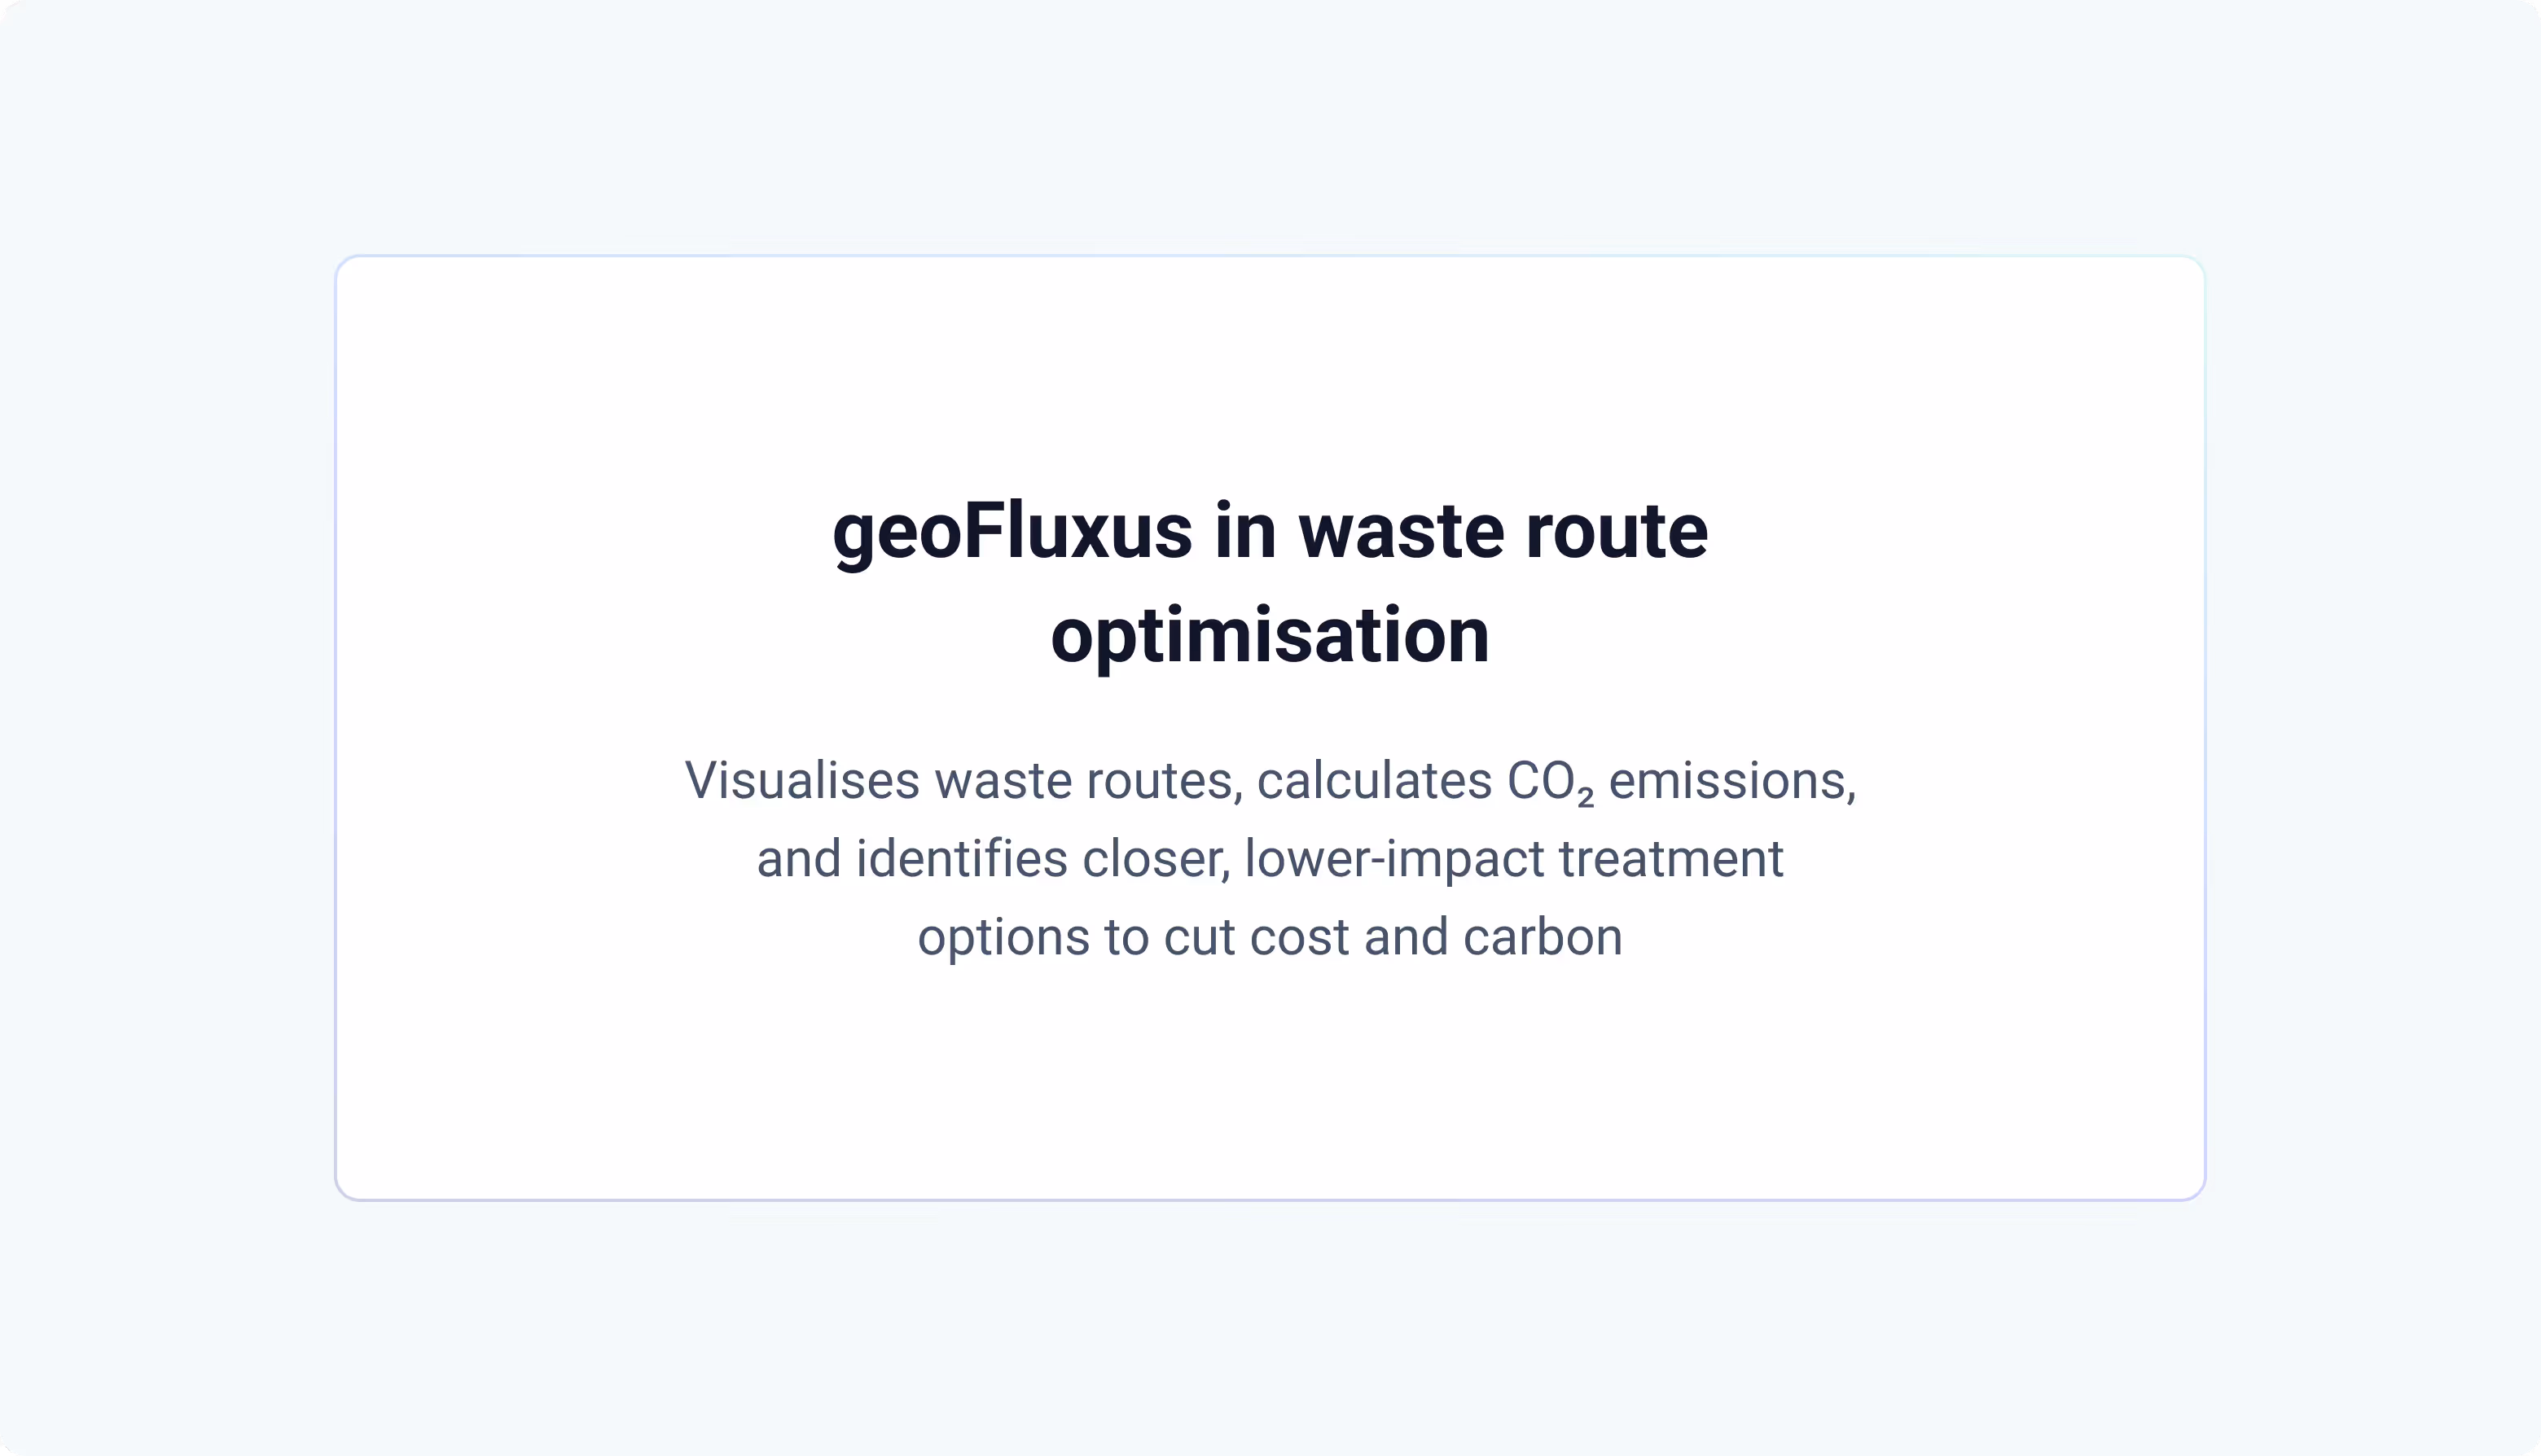
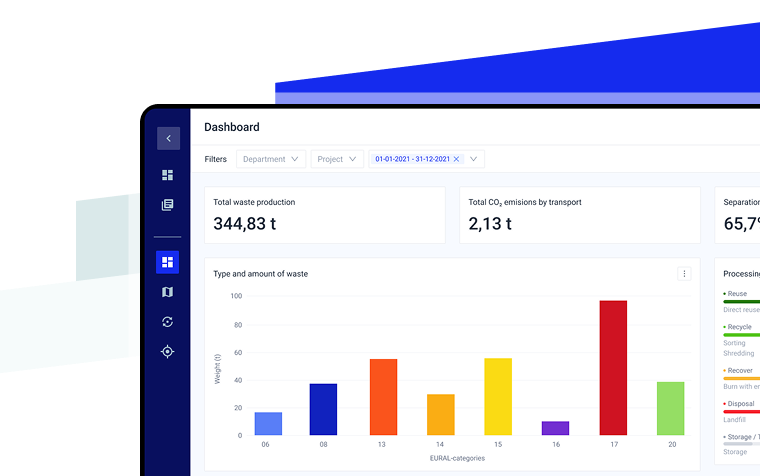
Today, geoFluxus brings that same geospatial intelligence to enterprises — visualising how far waste travels, calculating route emissions, and identifying closer or lower-impact treatment options.
By combining company data with public waste registries and verified emission factors, geoFluxus helps organisations understand their waste networks as they truly are — and as they could be. Instead of spreadsheets, teams work with living maps of their waste footprint, complete with CO₂ metrics and proximity-based improvement scenarios.
Because once you can see where waste goes, you can start to change where it ends up.
Conclusion
Waste transport is no longer a minor operational detail — it’s a measurable source of emissions and a growing focus of sustainability reporting. From the distance between processors to the type and weight of waste being moved, each factor influences both cost and the waste management industry’s climate impact.
The research is clear: most emissions come from waste travelling farther than it needs to. Yet with the right data — on routes, distances, and treatment locations, similar to methods used in other industries — organisations can start to see and improve what was once invisible. Route planning and optimisation offer a practical, evidence-based way to cut emissions by shortening journeys, consolidating loads, and aligning processing choices with proximity and circularity principles.
Making these routes visible turns waste management from compliance-driven reporting into an opportunity for measurable climate progress. Once you know where waste travels, you can start to decide how — and how far — it should go.
Ready to see it in action?
FAQs
What is route optimisation in waste management?
Route optimisation is the process of designing and scheduling waste collection journeys to minimise distance, time, and fuel consumption. In waste management, this means analysing every step from pickup to transfer stations and final treatment, ensuring vehicles take the most efficient routes possible. Although waste producers of waste don’t control these routes directly, they can influence emissions indirectly by choosing processors that meet service requirements and are closer to their sites. The shorter the journey to treatment, the lower the transport-related emissions.
How does waste routing reduce emissions?
Every unnecessary kilometre driven adds fuel use and CO₂ output. By analysing route data, consolidating smaller trips, and matching waste streams to closer processors, organisations can cut transport-related emissions.
What data is needed to optimise waste logistics?
Accurate routing depends on reliable, verifiable data. This includes manifests, invoices, weight records, and information about treatment locations. When combined and standardised — ideally through a platform like geoFluxus — this data provides the full picture: how much waste is moved, where it travels, and how far. With these insights, companies can calculate their emissions, identify inefficiencies, and improve both logistics and reporting accuracy.
Can route planning support CSRD/ISO reporting?
Yes. Route and emissions data directly support corporate sustainability frameworks. By quantifying transport distances and waste weights, companies can report Scope 3 emissions from waste logistics. Route-based insights make it easier to demonstrate measurable reductions and progress toward circularity and carbon goals.
How does geoFluxus differ from fleet or GPS systems?
Fleet management, GPS systems, or route optimization software are tools used by waste collection companies to plan and monitor their own vehicle routes. As a waste producer, you typically have no control or visibility over those systems. geoFluxus focuses on what you can influence: understanding how far your waste travels, which processors handle it, and where emissions occur.