
“Over the years we’ve invested significantly in our field data team - focusing on producing trusted ratings. While this ensures the accuracy of our Ratings, it doesn’t allow the scale across the thousands of projects that buyers are considering.”

For more information on carbon credit procurement trends, read our "Key Takeaways for 2025" article. We share five, data-backed tips to improve your procurement strategy.
One more thing: Connect to Supply customers also get access to the rest of Sylvera's tools. That means you can easily see project ratings and evaluate an individual project's strengths, procure quality carbon credits, and even monitor project activity (particularly if you’ve invested at the pre-issuance stage.)
Book a free demo of Sylvera to see our platform's procurement and reporting features in action.
What “Waste Data” Really Means for Enterprises
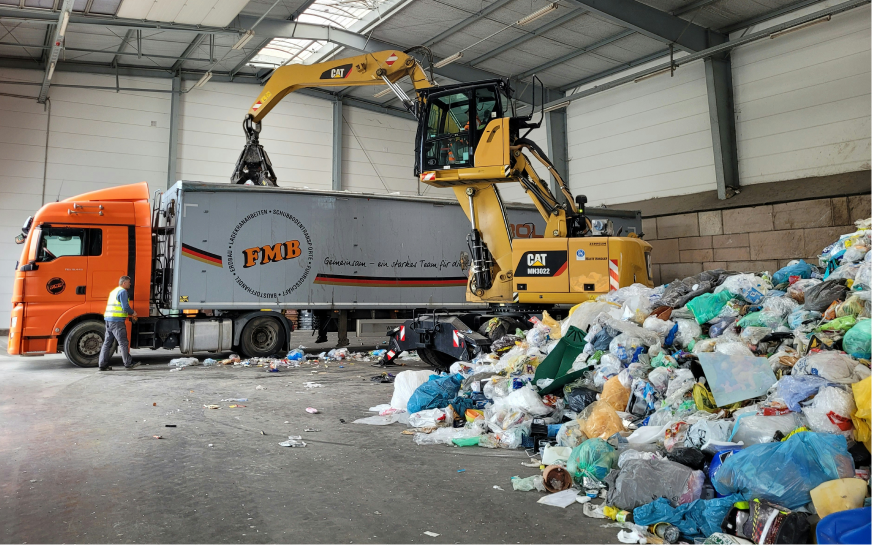
As enterprises expand across sites, countries, cities, and industries, the complexity of their waste management practices multiplies. Different processors, different waste streams, and different waste collection frameworks and systems make it nearly impossible to get a clear picture. The waste management sector itself has long been one of the least transparent, leaving organisations to take action on their own. What should be a single, consistent dataset often turns into a messy puzzle of formats, missing documents, and numbers that don’t align.
When audit time comes, hours are lost verifying numbers and searching for missing tickets. There isn’t one “easy export” button that pulls everything you need from existing systems. From our experience:
- Municipal data often lacks the completeness required for enterprise operations.
- Processor portals don't let you compare performance across vendors or sites—so you can’t benchmark or identify problems.
- ERP tools aren’t built for the complex world of waste management, difficulty handling multiple materials (paper, plastic, food waste, solid waste), and the nuanced definitions used in waste management.
And with waste now required for CSRD/ESRS, essential in ISO 14001 audits, and included in Scope 3, the sooner you centralise and verify data, the faster you can act.
Having proper insight into the entire waste chain—from waste generation and waste collection, through transportation, disposal, recycling, and recovery—transforms compliance from a burden into a business advantage. With reliable data, organisations can cut costs, reduce negative impacts, and build a more profitable economy that reuses secondary resources to create new products.
Core Data Sources & the Minimum Viable Data Model
The data collection of waste management requires a mixture of consolidation and standardization. This is simple to break down:
Source Types to Consolidate
The first step is to collect every relevant input into one dataset:
- Processor invoices and tickets
- Exports from processor platforms (if available)
- Bills of lading and transport logs (helpful for emissions and compliance)
- Local government and local authority data as a cross-reference
Key Fields to Standardise (Starter Schema)
This next step takes time, but it’s essential. The most reliable way to categorise waste is with EWC codes, which is the European standard but works well globally, or group by material type.
At minimum, capture:
- EWC and/or material
- weight
- date
- site of origin
- processor
- treatment type
- processing location
For emissions and route analysis, add:
- Distance travelled, transport mode (supports energy and emissions estimates)
For financial insight, add:
- Price, currency
A “minimum viable model” brings order to messy datasets by structuring information consistently across all sites. The result: consistent measurement and meaningful, like-for-like comparisons that actually allow for informed decisions.
Centralisation Patterns: OCR, EDI, APIs, ELT/ETL
Manual entry of invoice and ticket data is time-consuming and unreliable. The increased digitisation of this process not only saves time but also reduces the likelihood of costly errors. You might consider digital technologies like:
- OCR (Optical Character Recognition): Scans PDFs and extracts fields. At geoFluxus, our OCR is specially tuned for waste documents—freeing teams from manual entry.
- EDI (Electronic Data Interchange): Efficient for bulk processing when documents share a standard structure.
- APIs: Real-time links between invoicing platforms and your database.
This backbone enables robust data analytics on waste management (e.g., shifts in disposal vs recycling, decline in composting, growth in disposal of materials).
⚠️ Any integration can introduce risk. Validate security, protect sensitive company information, and ensure vendor systems are reliable to avoid unforeseen incidents.
Verification & Auditability: From Raw to “Decision-Grade” Data
Verification ensures your waste data reporting stands up to audit scrutiny. Therefore, once your data is centralised, check whether it’s reliable enough for data analytics, audits, and decision-making.
To make your waste reporting audit-ready, every dataset should meet the following quality standards:
- Completeness: Ensure all required fields, waste streams, and shipments are captured. Missing ticket IDs or processor entries should be flagged automatically.
- Accuracy: Verify that reported data matches reality — for example, by cross-checking invoices against tickets or weighbridge slips.
- Timeliness: Confirm that data is submitted on schedule. Monthly waste volumes should be recorded by each reporting cutoff.
- Consistency: Standardise units, naming conventions, and coding across all sites (e.g. converting kilograms to tonnes).
- Uniqueness: Eliminate duplicates such as repeated certificates or invoices to avoid double-counting.
- Lineage: Maintain full traceability by linking each ticket or record back to its original source file, such as a PDF or manifest.
Anomaly Detection
Add rules to flag patterns outside the norm:
- More than ±15–20% change vs previous month/quarter
- Negative weights
- Distances greater than expected
Some anomalies are valid (e.g., new projects, seasonal production); review them to minimize errors. Once confidence in data quality is established, the next step is aligning it with the regulatory frameworks against which enterprises must report.
Map Your Data to Standards: ESRS E5, ISO 14001, e-MJV
Each framework has distinct requirements:
- ESRS E5-5 Waste Outflows: Totals, hazardous waste, and processing methods by material.
- ISO 14001: All ESRS data plus audit trails, improvement plans, operational controls, and legal compliance.
- e-MJV (Netherlands): Totals, hazardous waste, processing methods, and international transport of hazardous waste.
Aligning to these standards creates a single waste management reporting backbone covering multiple countries, easing evidence requests and making year-end close far easier.
Make the Data Actionable: Dashboards, KPIs, and Alerts
The benefits of verified waste data are that you can now; identify opportunities, plan improvements, and monitor progress. Create a dashboard to turn the data into actionable insights.
Executive KPIs
- Recycling rate – Aim for 85%+
- Separation rate – Aim for 85%+ (higher rates boost reuse of materials)
- Landfill & incineration rate – Keep below 5%
- Total CO₂ from waste – Processing + transport (supports climate reporting)
- €/tonne – Cost of processing (spot efficiencies across companies and sites)
Operational Checks
- Processor performance: Are vendors meeting best practices? GeoFluxus’ waste global database lets you compare performance directly with national standards.
- Transport distances: Are you shipping waste unnecessarily far?
- Site variance: Which locations are producing more waste? Why is one site performing better or worse than another?
- Treatment mix: Monitor trends in disposal, recycling, composting, and recovery.
Alerts & Workflows
Turn checks into action. Instead of learning about data issues at audit time, configure real-time alerts for:
- SLA breaches – Vendor fails to deliver tickets/invoices on time
- Missing documents – e.g., pages or files required for compliance
- Month-end close status – See which sites/vendors have complete, validated data (and which don’t)
This ensures your reporting is always based on complete, trusted information—not guesswork.
Governance & Roles (RACI)
Waste data is complex, not just because of the data itself, but because of how many stakeholders are involved. Clear responsibilities make all the difference. Here’s a potential overview:
- QHSE: Define what “good data” means; ensure audit-ready evidence
- Sustainability: Map numbers to CSRD/ESRS and track progress
- Procurement: Manage vendor SLAs with waste management companies
- Finance: Validate costs and ensure invoices match collected volumes
- IT/Data: Maintain integrations, systems, and access controls
Shared ownership keeps teams accountable and prevents bottlenecks.
Conclusion
Centralise → verify → act = lower cost, lower risk, higher circularity.
A clean, standardised dataset unlocks practical solutions across industries:
- Switch to closer processors to reduce transportation emissions
- Replace materials in production processes to cut hazardous waste
- Recover materials and resources for new products and energy
- Reduce pollution and improve outcomes for the environment
With the right backbone, regulatory reporting becomes repeatable and useful. Continuous data collection throughout the year lets you steer proactively—instead of drowning in paperwork at year-end. And you don’t have to build it alone. With geoFluxus, you can get there faster.
FAQs
What is waste data management in simple terms?
It’s the practice of bringing all your waste management data—tickets, invoices, transport logs, and certificates—into one central system. With a single verified dataset, you can see how much waste is generated, whether it falls under liquid or solid waste management, which waste streams it belongs to (plastic, paper, food, municipal solid waste), and where it ends up (recycling, landfill, or composting). This visibility goes beyond passing audits; it helps cut costs, reduce pollution, and strengthen sustainability performance.
What waste data should we collect from processors?
To get a dataset that provides a full view of how waste is generated, collected, transported, and processed. At a minimum, organisations should request:
- Ticket IDs and dates
- Material or waste types (paper, plastic, food waste, hazardous waste, etc.)
- Weights and volumes
- Treatment types (recycling, landfill, incineration, composting, recovery)
- Pickup and processing locations
- Transport details (distance, mode of transport)
- Invoices
How do we verify for ESRS E5 and ISO 14001?
By making sure every shipment has a linked document, invoices match tickets, units are consistent, and anomalies (like spikes in waste generation or long transport distances) are flagged. This keeps data reliable and compliant and helps spot problems early.
Which KPIs matter most for cost and circularity?
Recycling rate, separation rate, landfill/incineration rate, processor performance, €/tonne, and CO₂/tonne.
How do we start if most data is PDFs?
Use OCR to turn scanned tickets into structured data, then move to EDI/APIs as vendors mature. GeoFluxus’ DocumentAI extracts exactly what you need to track progress and measure trends.